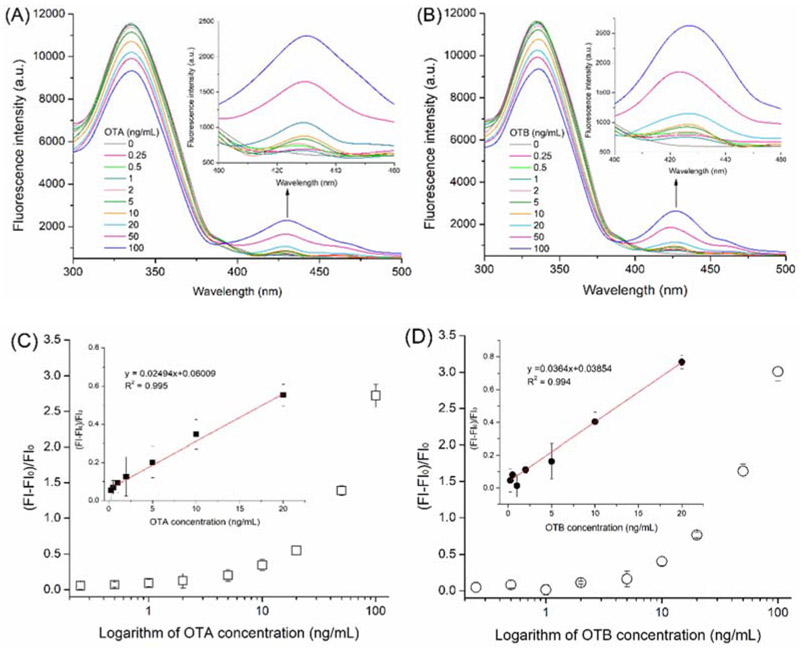
Figure 3.
Fluorescence emission spectra of solutions containing 5 μg/mL Nb28 and various concentrations of OTA (A) and OTB (B), and plot of relative fluorescence intensities (FI-FI0)/FI0 at 430 nm of the antigen/Nb complex as a function of concentration of OTA (C) and OTB (D). The fluorescence spectra were recorded with excitation at 280 nm. Inset in: linear portion of the plot. The error bars indicate standard deviations of data from experiments performed in triplicate.

