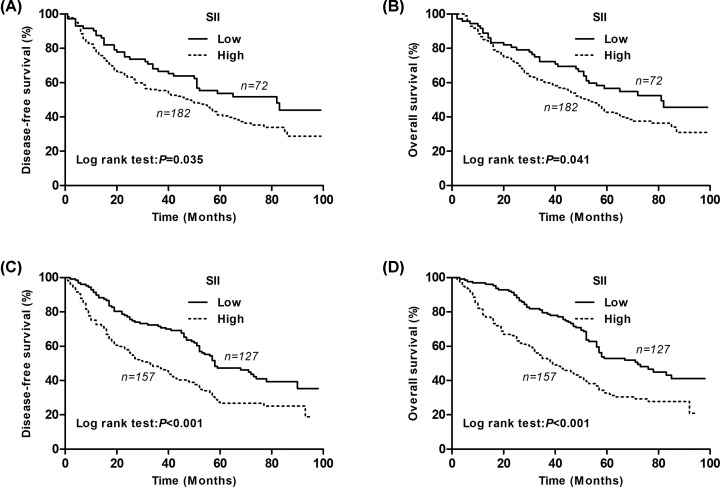
Figure 2. Kaplan–Meier survival curves for SqCC and non-SqCC patients according to the SII levels.
(A) Kaplan–Meier survival curve of DFS for SqCC patients (log-rank, P=0.035). (B) Kaplan–Meier survival curve of OS for SqCC patients (log-rank, P=0.041). (C) Kaplan–Meier survival curve of DFS for non-SqCC patients (log-rank, P<0.001). (D) Kaplan–Meier survival curve of OS for non-SqCC patients (log-rank, P<0.001).

