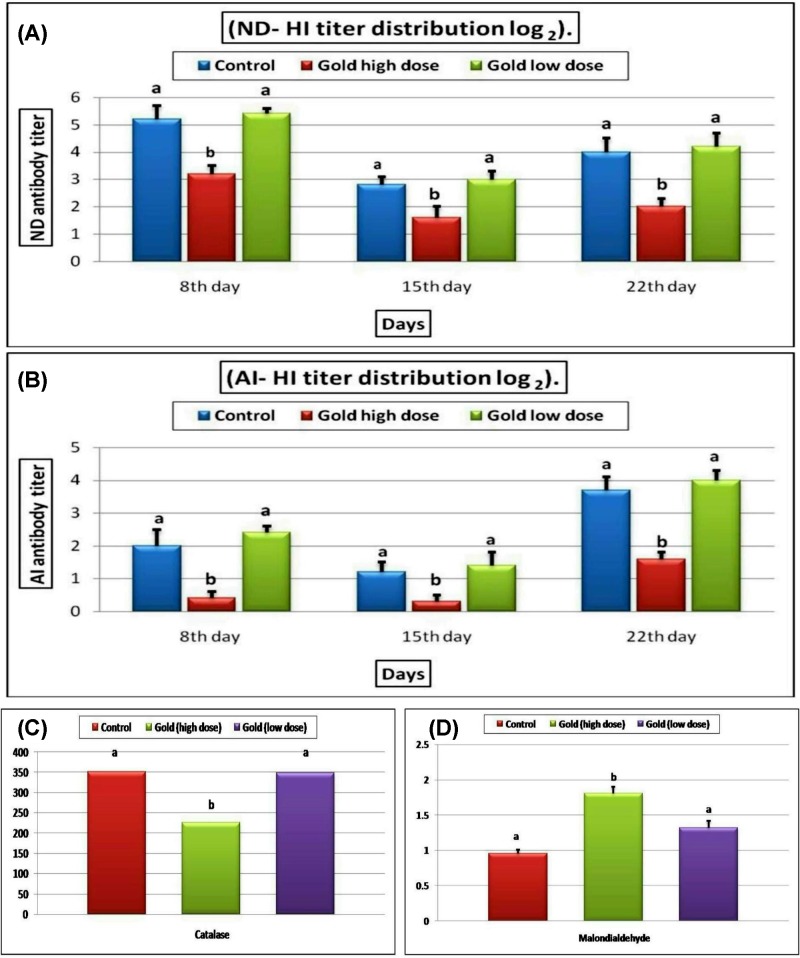
Figure 3. Blood antibody titer and oxidative stress parameters.
Bar chart representing the effect of different concentrations of GNPs on blood antibody titer against ND (A) and AI virus (B), serum MDA level (C), Blood CAT activity (D) in different groups of broiler chickens. All values were presented as mean ± SEM (n=7 birds/ group). Values with different letters were significantly different at P≤0.05.

