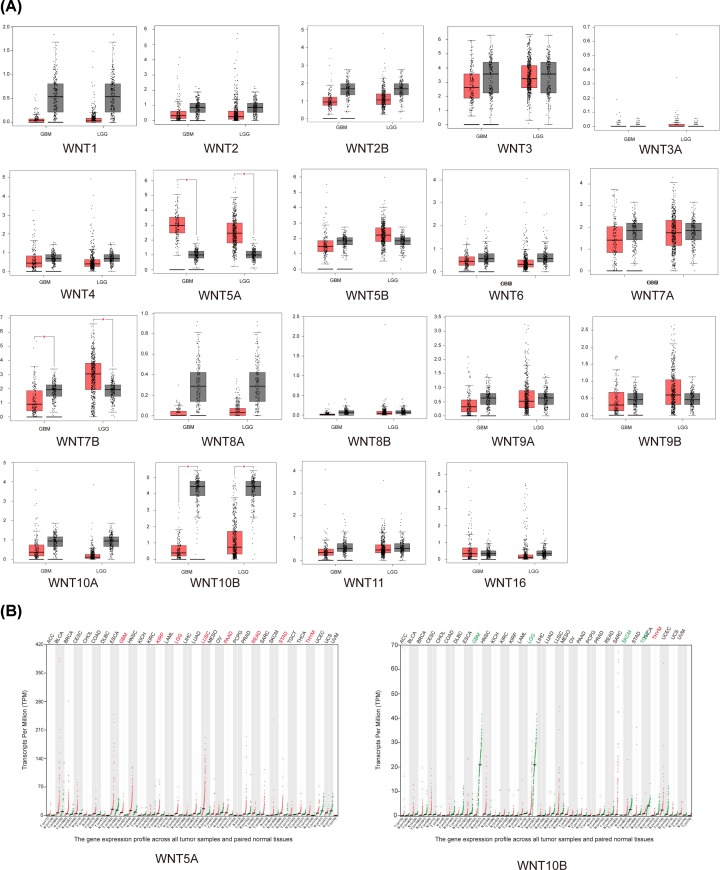
Figure 2. mRNA expression of 19 WNT genes in glioma including GBM and LGG compared with NB tissue using GEPIA.
(A) Statistically significant higher expression of WNT5A and lower expression of WNT10B in both GBM and LGG compared with NB (GBM: n= 163, LGG: 518, NB: n= 207) analyzed with TCGA and GTEx datasets (P <0.05). (B) Higher expression of WNT5A and lower expression of WNT10B in GBM and LGG compared with other human tumors.

