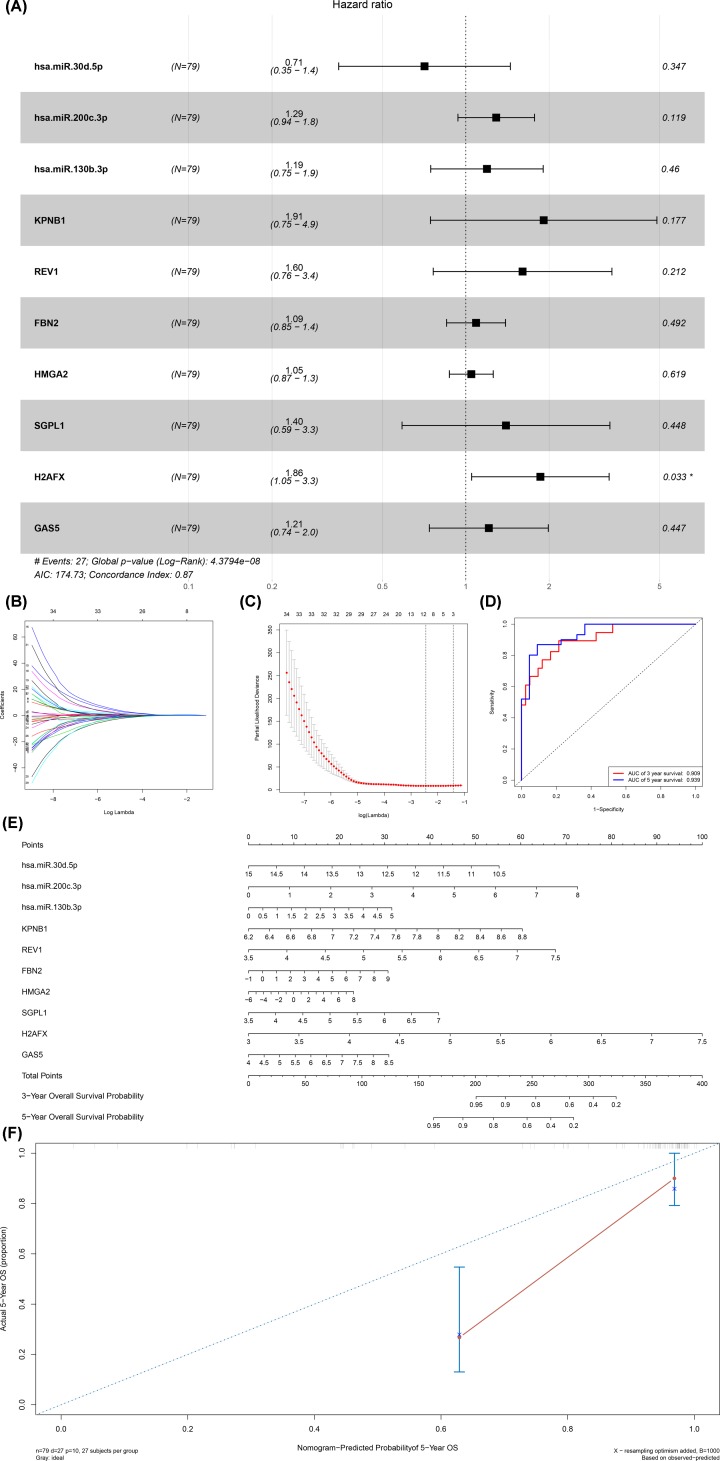
Figure 4. Construction and model diagnosis of prognostic nomogram including key members of ceRNA network.
The results of the multivariate Cox regression (A), nomogram (E) and model diagnosis process (B,C,D and F) based on the key members in the ceRNA network. hsa-miR-30d-5p, hsa-miR-200c-3p, hsa-miR-130b-3p, KPNB1, REV1, FBN2, HMGA2, SGPL1, H2AFX and GAS5 were incorporated into the Cox proportional hazards model. Nomograms for predicting patients’ prognosis were constructed based on the Cox model (E). Lasso regression results show that there is no over fitting (B and C). Receiver Operating Curve (ROC) (D) and calibration curve were used for assessing the accuracy and discrimination of the nomogram (F). Area Under Curve (AUC) of the 3- and 5-year survival was 0.909 and 0.939, respectively.

