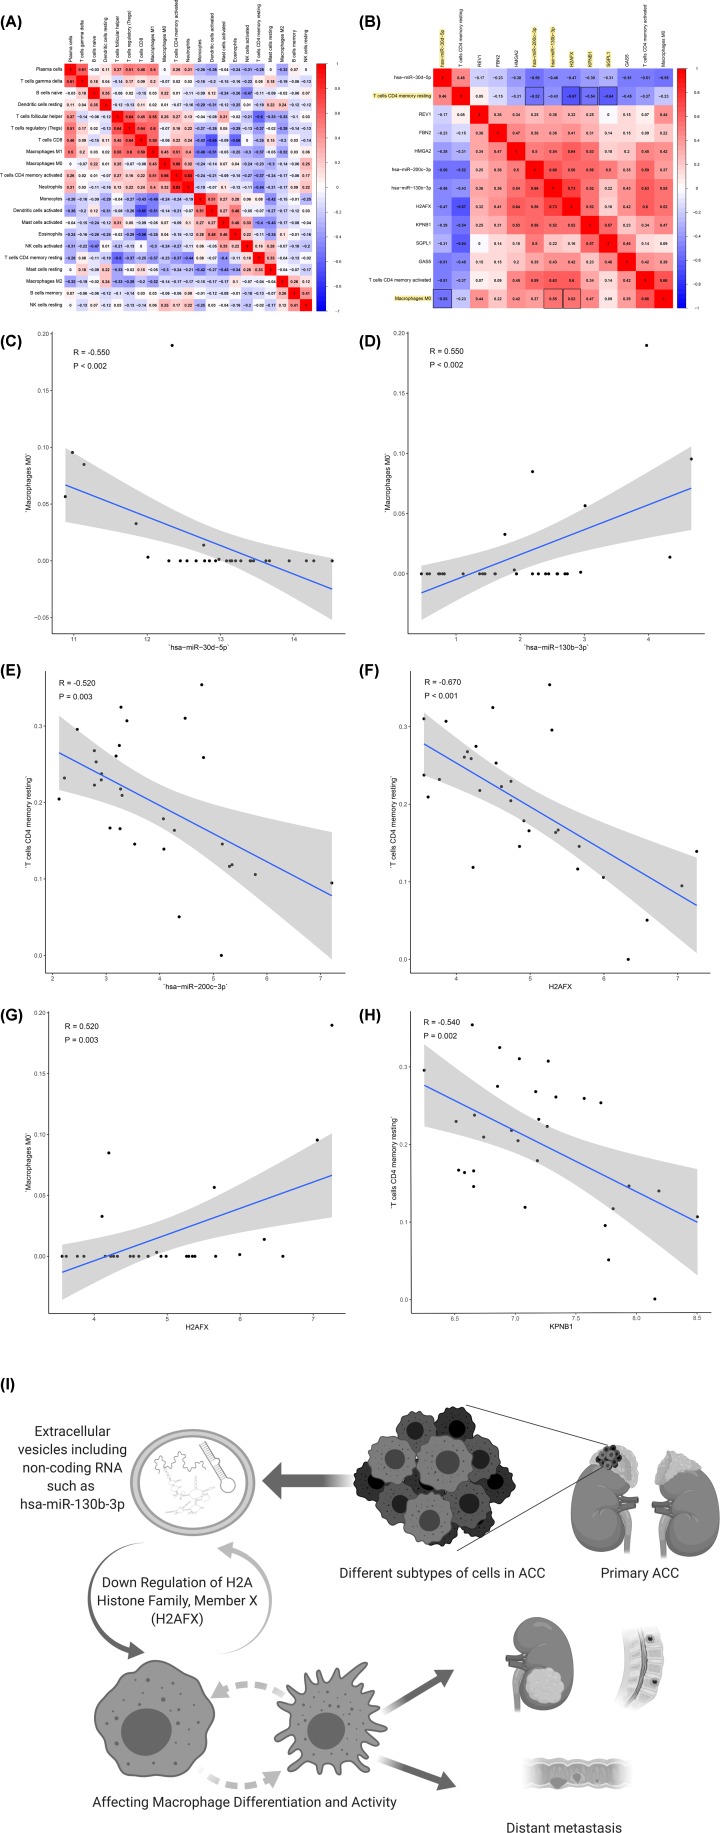
Figure 8. The results of co-expression analysis and the speculative mechanism diagram including metastasis-specific ceRNAs and immune cells with co-expression patterns.
The co-expression patterns among fractions of three immune cells and ten key members in the ceRNA network (B) and the correlation analysis of the proportion of immune cells (A). Linear relationship between immune cells and genes with high col-linearity (P > 0.5 or P < -0.5) (C–H). The results are as follows: T cells CD4 memory resting and hsa-miR-200c-3p (R = -0.520, P = 0.003), T cells CD4 memory resting and H2AFX (P = -0.670, P < 0.001), T cells CD4 memory resting and KPNB1 (R = -0.540, P = 0.002), T cells CD4 memory resting and SGPL1 (R = -0.640, P < 0.001), macrophages M0 and hsa-miR-30d-5p (R = -0.550, P < 0.002), macrophages M0 and hsa-miR-130b-3p (R = 0.550, P < 0.002), macrophages M0 and H2AFX (R = 0.520, P = 0.003). A speculative mechanism diagram of the core scientific hypothesis (I).

