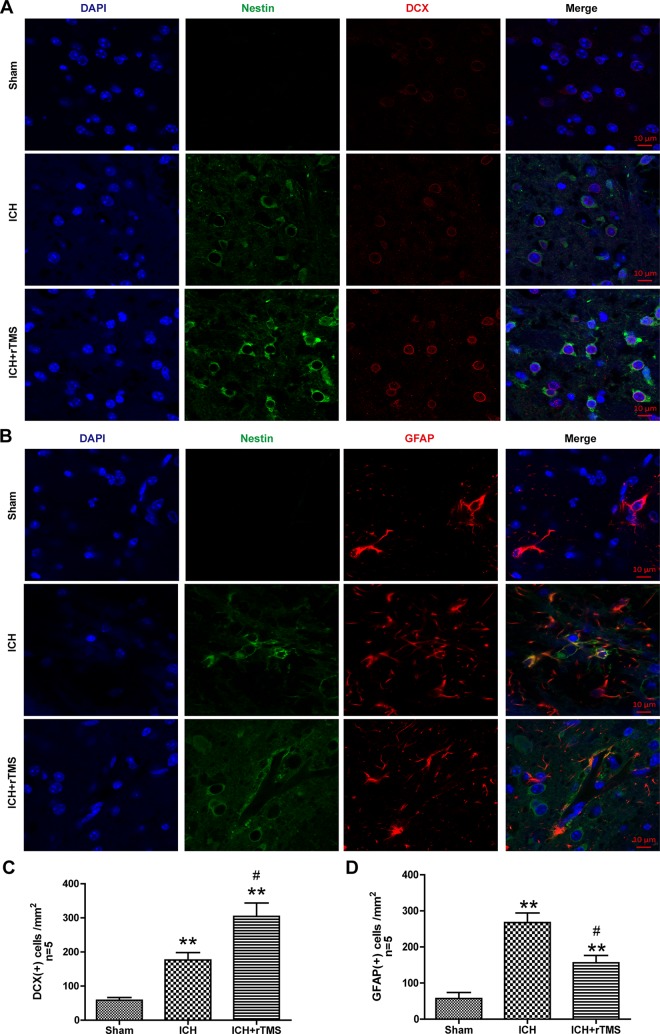
Fig. 4.
The effects of rTMS on the differentiation of NSCs after ICH. (A) Representative photographs of immunofluorescence co-staining of NSCs for DAPI (blue), Nestin (green) and DCX (red) and (B) immunofluorescence co-staining of NSCs for DAPI (blue), Nestin (green) and GFAP (red) in the sham, ICH, and ICH+rTMS groups at 72 h after ICH. (C) Quantitative analyses of DCX-positive and (D) GFAP-positive cells in the sham, ICH, and ICH+rTMS groups at 72 h after ICH. n = 5 for immunofluorescence staining analysis. Scale bar = 10 μm; **p < 0.01 vs. sham; #p < 0.05 vs. ICH.

