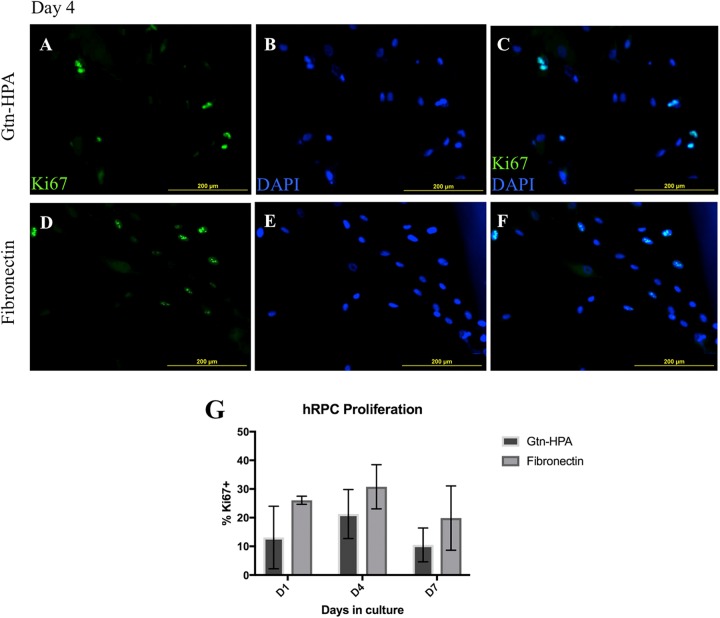
Fig. 2.
Ki-67 staining of hRPCs as a marker of proliferation. (A–F) Representative photos of hRPCs cultured for 96 hours within Gtn-HPA (A–C) or on fibronectin (D–F). Ki-67 in green, DAPI in blue. Ki-67+ cells show clear heterochromatin-like pattern (bottom left). Ki-67+ signals are shown to have nuclear localization, from co-staining with DAPI. (G) Quantification of percentage population of Ki-67+ cells. Two-factor ANOVA did not show significant effect of culture conditions (Gtn-HPA vs. fibronectin) on percentage of Ki-67+ cell numbers after post hoc analysis (F(1, 12)=6.276, p=0.028; post hoc D1: p=0.213, D4: p=0.702, D7: p=0.467).

