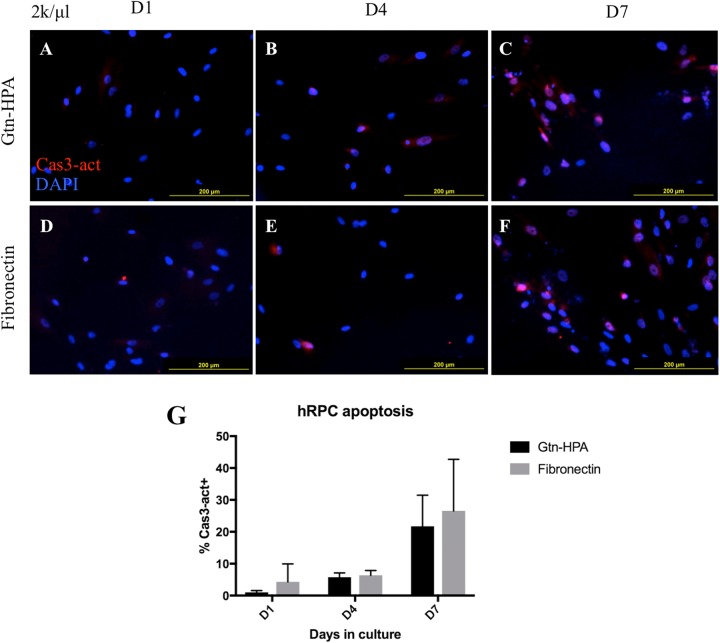
Fig. 3.
Activated Caspase-3 staining of hRPCs as a marker of apoptosis. (A–F) Representative photos of cells grown in a thin layer of Gtn-HPA or on fibronectin-coated coverslips, at days 1, 4, and 7 post-culture. Red = Caspase-3, Blue = DAPI. Scant intracellular staining with activated Caspase-3 is seen by day 4 in both groups (B and E), whereas by day 7 a large proportion of cells show nuclear localization of activated Caspase-3 (C and F). (G) Quantification of percentage activated Caspase-3+ cells. Two-factor ANOVA did not show significant effect of culture conditions on apoptotic cell populations (F(1, 16)=0.914, p=0.353).

