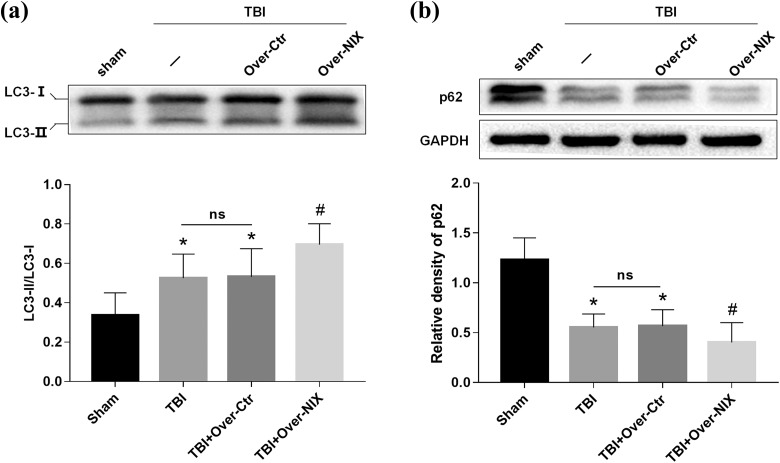
Fig 5.
Detection of autophagy changes after overexpression of NIX. a. LC3 protein bands were analyzed by Western blot at 24 h after TBI, and then the ratios of LC3-II with LC3-I were determined by quantification graphs. b. P62 expression was also tested by Western blot and quantification analysis as described. GAPDH was used as an internal control to confirm equal quantities of protein loading as well. Data are shown as the mean±SEM (n = 6, *P < 0.05 vs. sham, #p < 0.05 vs. Over-Ctr).

