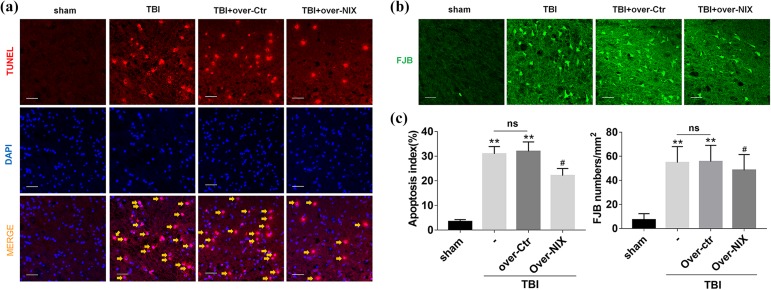
Fig 6.
Detection of apoptosis changes after overexpression of NIX. a. At 24 h after TBI, sections were labeled with TUNEL-activated cells (red) and DAPI (blue), and then, in merged images, cells shown by the orange arrows were counted for statistical purposes. b. FJB-activated cells marked by green were also photographed by LAS X software. Scale bars, 50 µm. c. Quantification graphs of the apoptosis index and FJB-activated cells were drawn separately as described. Data are shown as the mean±SEM (n = 6, **P < 0.01 vs sham, #P < 0.05 vs. Over-Ctr).

