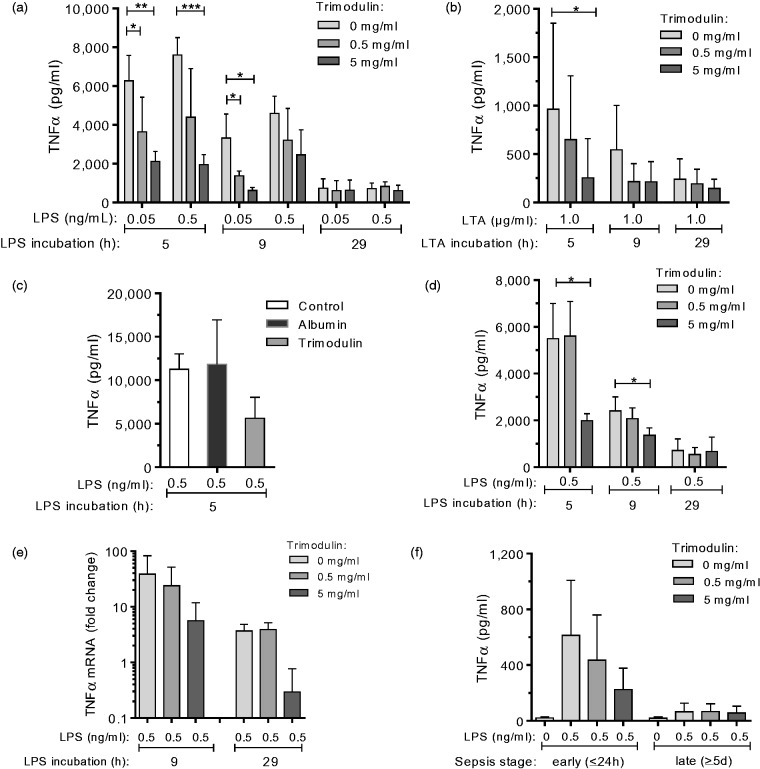
Figure 2.
TNF-α secretion upon repeated endotoxin stimulation and trimodulin treatment. Purified PBMCs (a, n = 5; b, n = 7; c, n = 3) or whole blood (d, n = 5) from healthy donors were challenged with LPS (a, c and d) or LTA (b) and treated with trimodulin according to the second hit protocol shown in Figure 1(a). (c) Control experiment performed by simultaneous incubation of PBMCs (n = 3) with LPS, without (control) or with 5 mg/ml trimodulin, or with an equimolar concentration of albumin for 1 h, followed by a second LPS* hit for a total LPS incubation time of 5 h. (e) RT-PCR analysis showing fold change in TNF-α transcript levels in PBMCs (n = 3) from healthy donors upon treatment compared to non-treated cells (no LPS, no trimodulin). (f) Whole blood obtained from patients with sepsis in the early (n = 7) or late (n = 8) phase was treated with trimodulin and with 0.5 ng/ml LPS* or without endotoxins (control) as shown in Figure 1b. (a–d and f) The TNF-α concentration in PBMC supernatants or in plasma from whole blood was analysed by ELISA. Bars represent mean ± SD. Differences versus control (0 mg/ml trimodulin) are indicated with asterisks (*P ≤ 0.05, **P ≤ 0.01 and **P ≤ 0.005 using a parametric paired t-test). Paired one-way ANOVA showed strong correlations (a, P ≤ 0.001; b, P ≤ 0.05) between trimodulin dose (5 and 9 h) and TNF-α detection.

