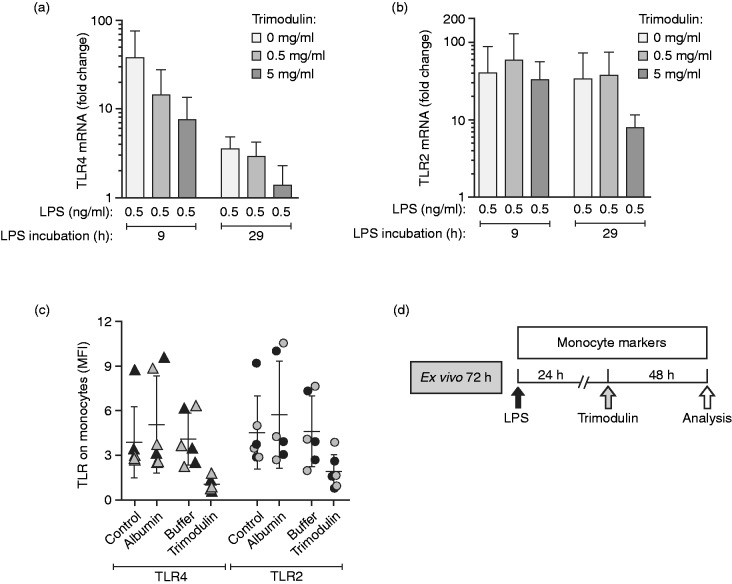
Figure 3.
Regulation of TLR expression in monocytes. (a–c) PBMCs from healthy donors (n = 3) were treated according to the second-hit model depicted in Figure 1a for 9 or 29 h without endotoxin (control) or with 0.5 ng/ml LPS and LPS*, and with or without trimodulin. (a) RT-PCR analysis showing fold change in TLR4 mRNA and (b) TLR2 mRNA compared to untreated cells (no LPS, no trimodulin) and analysed after the second LPS* hit. (c) Detection of TLR2 and TLR4 on monocytes after 9 h (black symbols) or 29 h LPS/LPS* stimulation (grey symbols) including either 5 h albumin, formulation buffer or trimodulin treatment, or without further additives (control). (d) Single endotoxin dose (one hit) model representing treatment of early inflammation (24 h) with trimodulin. This model was used for experiments presented in Tables 2 and 3. PBMCs from healthy donors were stimulated with 0, 0.05 or 0.5 ng/ml LPS, or 0, 1 or 10 µg/ml LTA. After 24 h of LPS/LTA, different trimodulin concentrations (0, 0.5 or 5 mg/ml) were added for 48 h prior to analysis of cells by flow cytometry (total incubation time: 72 h). Bars in a–c represent mean (n = 3 ± SD).

