
Figure 1.
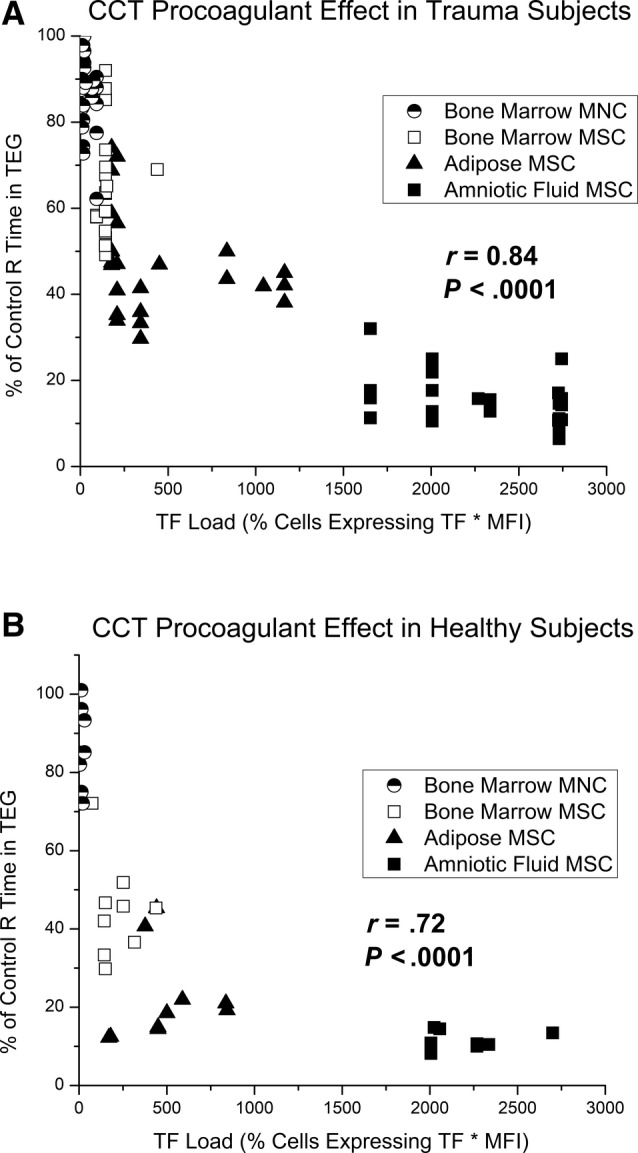
A, Pearson's correlation between relative TEG R time and tissue factor (TF) load in trauma patient blood samples. Each blood sample was treated with amniotic fluid MSC, adipose MSC, bone marrow MSC, or bone marrow MNC in separate TEG assays to determine a percent change in R time from controls. TF load was determined on the day of testing using flow cytometry. CCTs that express high levels of TF decrease R time more than those that express low levels of TF. Pearson' correlation of conglomerate data was excellent with r of .84, P < .0001. B, Pearson's correlation between relative TEG R time and TF load in healthy subject blood samples. CCT, clinical cellular therapeutic; MNC, mononuclear cell; MSC, mesenchymal stromal cell