Figure 1.

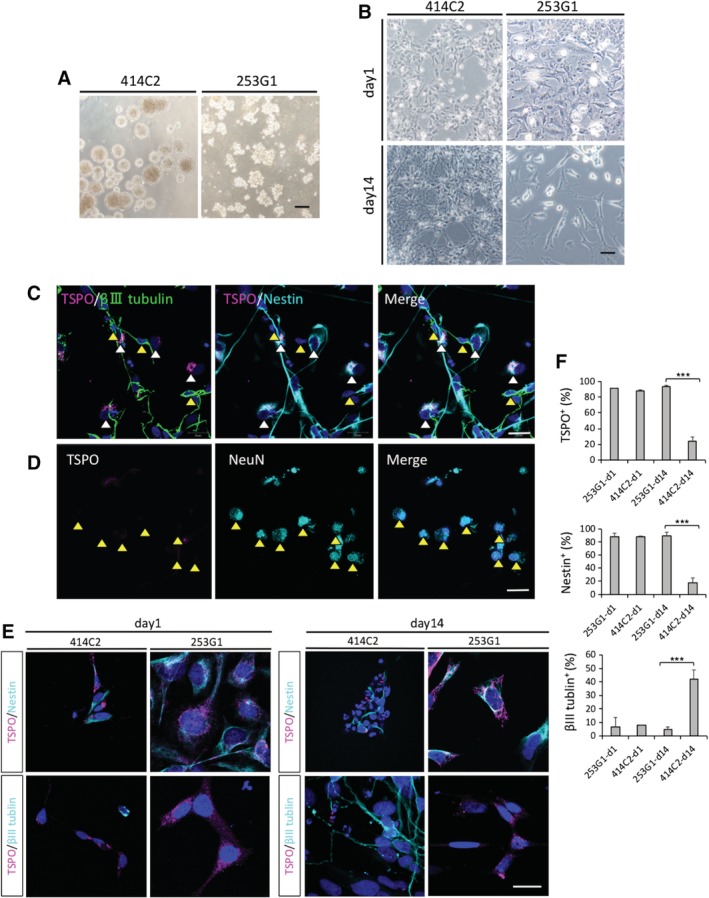
Immunohistochemistry results of the in vitro differentiation of hiPSC‐NS/PCs revealed different levels of TSPO expression between 253G1‐ and 414C2‐NS/PCs during neuronal induction. A, Representative images of micrographs showing hiPSC‐NS/PCs aggregates for each group and cell line. B, Representative images of micrographs before and after hiPSC‐NS/PCs neural differentiation. C‐F, hiPSC‐NS/PCs dissociated into single cells, seeded on coverglasses, and immunostained with TSPO, β III‐tubulin (a neuronal marker), Nestin (an NS/PC marker), NeuN (a mature neuronal marker). C, D, Fourteen days after neuronal induction of 414C2‐NS/PCs (414C2‐d14), sections were triple‐stained with TSPO (red), β III tubulin (green), and Nestin (cyan blue). Most cells coexpressed TSPO and Nestin (white arrow heads) contrary to β III tubulin+ cells which did not express significant amounts of TSPO (yellow arrow heads) (C). 414C2‐d14 sections were stained with TSPO (red), NeuN (cyan blue) (yellow arrowheads indicate TSPO− and NeuN+ cells) (D). The nuclei were stained with Hoechst 33258. E, Representative staining results for each hiPSC‐NS/PCs during neuronal differentiation, comparing d1 and d14. The nuclei were stained with Hoechst 33258. F, Bar graph showing the percentage of TSPO+, Nestin+, and β III tubulin+ cells. Values are mean ± SD (n = 3, for each cell type). ***P < .001. Scale bars = 200 μm in (A), 50 μm in (B), 20 μm in (C‐E). hiPSC‐NS/PCs, human‐induced pluripotent stem cell‐derived neural stem/progenitor cells
