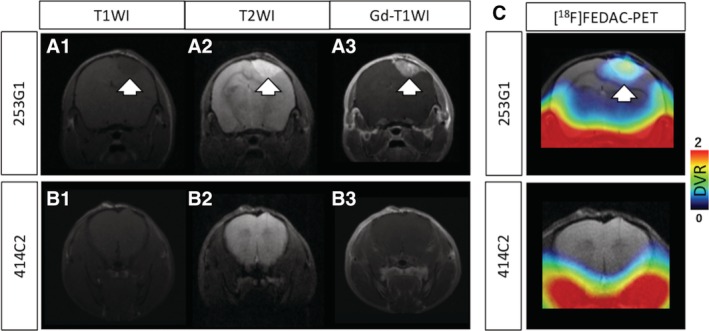
Figure 4.

Comparison of [18F] FEDAC‐PET and gadolinium‐enhanced MRI. A,B, Representative MRI images of in each hiPSC‐NS/PCs grafted mouse coronal brain. T1‐weighted imaging (A‐1, B‐1); T2‐weighted imaging (A‐2, B‐2); and gadolinium enhanced T1‐weighted imaging (A‐3, B‐3). C, Corresponding [18F] FEDAC‐PET/MRI fusion images of each hiPSC‐NS/PCs transplanted mouse coronal brain. Arrows indicate the transplanted 253G1‐NS/PCs depicted by MRI and were transferred to PET images. hiPSC‐NS/PCs, human‐induced pluripotent stem cell‐derived neural stem/progenitor cells; MRI, magnetic resonance imaging; PET, positron emission tomography
