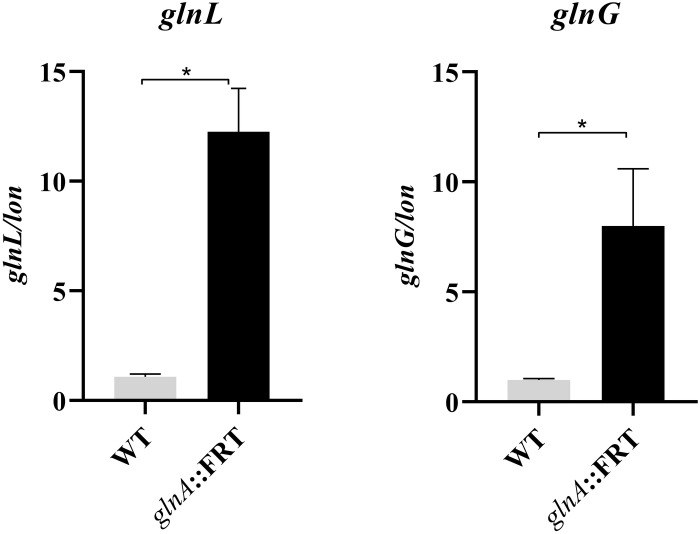
FIGURE 5.
Expression level of glnL and glnG transcripts in the mutant glnA::FRT compared to WT strain. Expression of transcripts was normalized to the expression of lon and compared to the expression of glnL or glnG in the of WT strain. Results are average of at least three biological replicates. Asterisks indicate significance, calculated by Student’s t-test, of results liked by brackets. *p ≤ 0.05.

