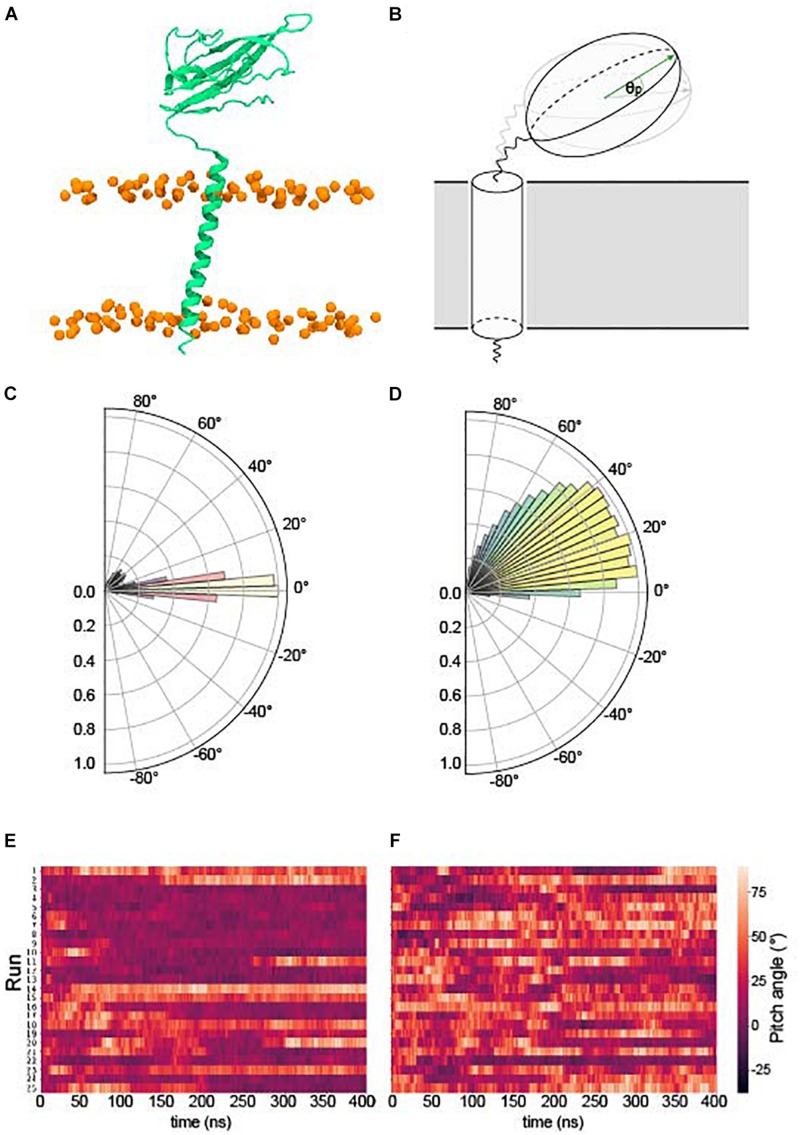
FIGURE 2.
Pitch angles of the β1/3 Ig domain. (A) The starting conformation of both β1 and β3 subunits. (B) Schematic illustrating the pitch angle, θp (see section “Ig Orientation Analysis” for precise definition). (C) Histogram of the pitch angles visited of over 400 ns × 25 runs of the β1 – subunit. (D) Histogram of the pitch angles visited of over 400 ns × 25 runs of the β3 – subunit. (E) Heatplot of pitch angles over 400 ns in the β1 subunit. (F) Heatplot of pitch angles over 400 ns in the β3 subunit.

