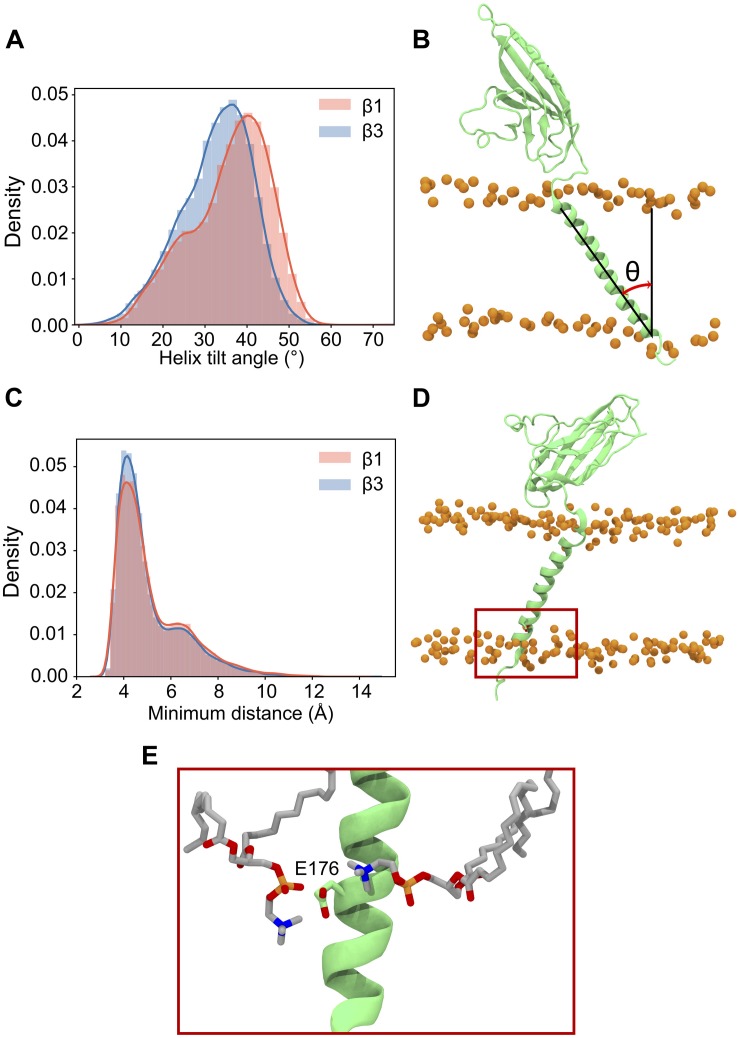
FIGURE 3.
Tilting and position of E177(β1)/176(β3) in the β subunit transmembrane domain. (A) Histogram of TMD tilt angles over 25 × 400 ns simulations of the β1 (red) and β3 (blue) subunits. (B) Schematic of the angle used to measure the tilt angle in the TMD, phosphorus atoms of the POPC bilayer are shown as orange spheres. (C) Histogram of minimum distances between E177 (β1)/E176 (β3) (center of mass of sidechain oxygens) and the nitrogen atom of the surrounding POPC headgroups over 25 × 400 ns. The shoulder at a distance of 7 Å reflects the initial starting coordinates. (D) Position in the membrane of the conserved glutamic acid residue (highlighted inside a red box) in the β3 subunit after 400 ns. (E) Closer look at E176 (β3) in (D) with two nearby POPC residues interacting with the terminal oxygen atoms of the residue.

