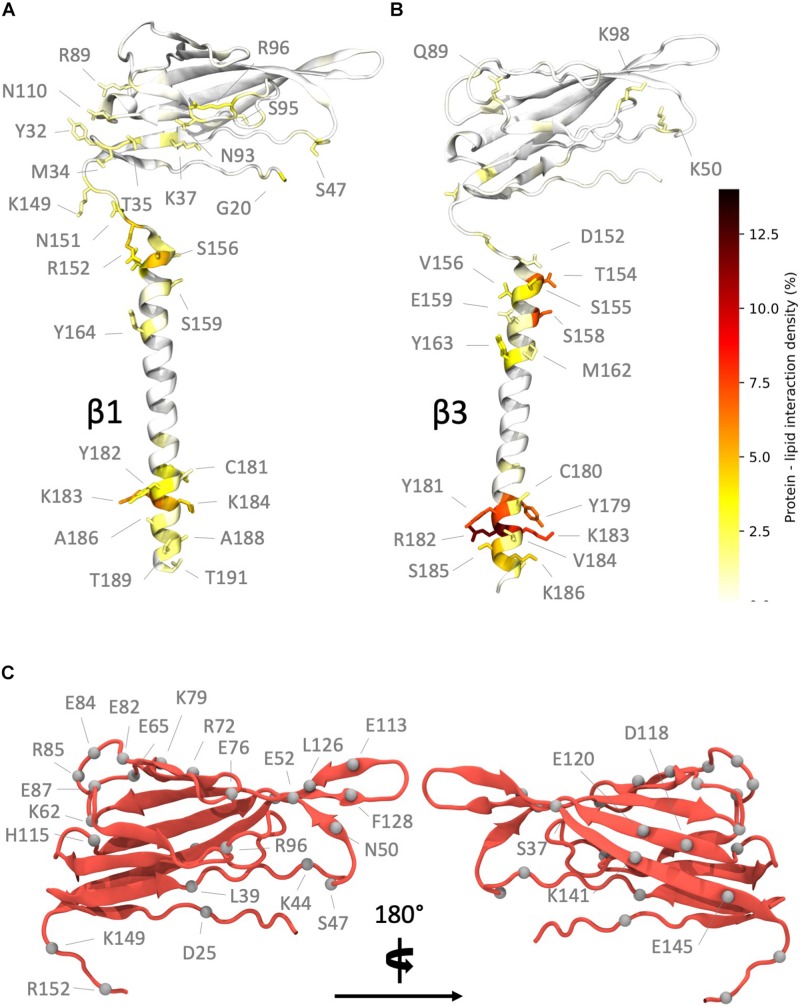
FIGURE 4.
Regions of high interaction on the β subunit with a POPC membrane and non-conserved residues between subunits. (A) Regions of frequent interaction on the β1 subunit. (B) Regions of high interaction on the β3 subunit. The ECD of β1 exhibits more frequent regions of contact when compared to β3. (C) Non-conserved residues (shown as gray spheres) in the β1 subunit Ig and linker domains (some labels omitted in right hand image for clarity).

