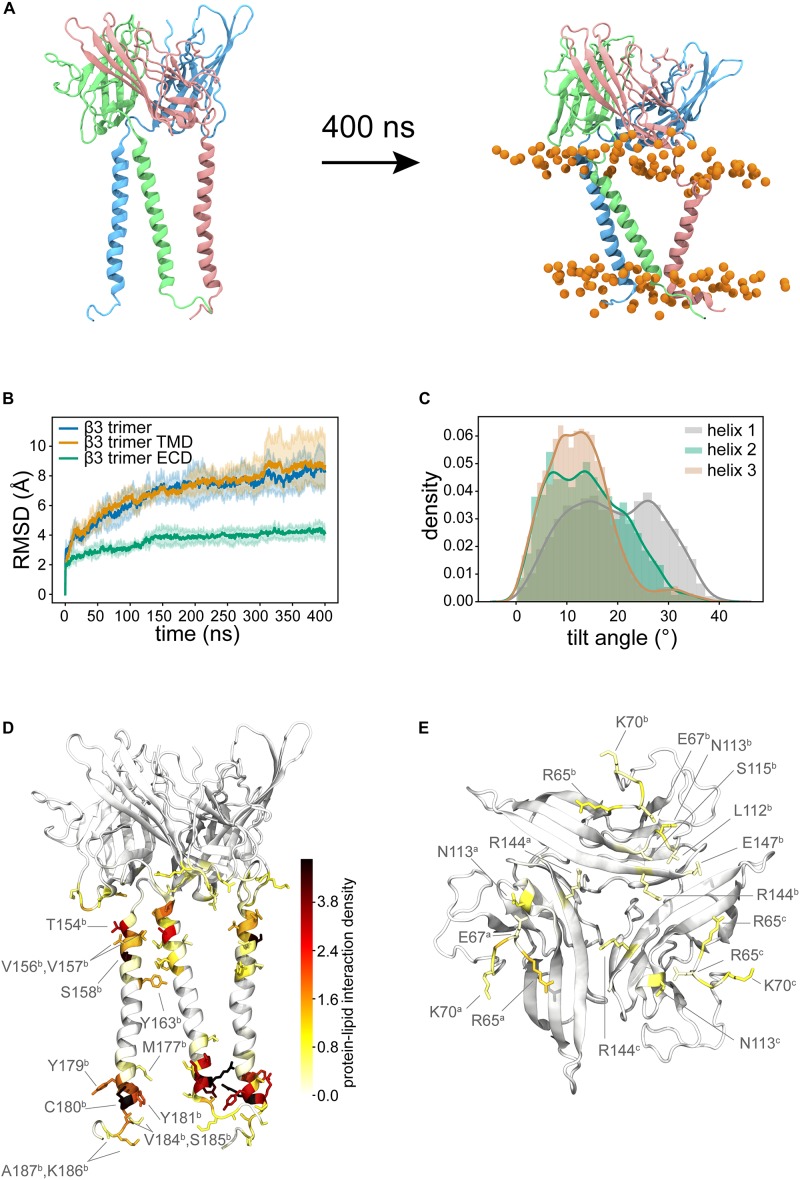
FIGURE 6.
Trimeric model of full-length β3. (A) Shows the initial configuration with TM helices that almost parallel to the membrane normal. During the simulation, the TM helices adopt tilted orientations and the ECD domain continues to sit in a similar position to the initial configuration. (B) Average Cα RMSDs (from three runs) for the whole trimer (blue), the TM domains (orange, residues F153 to E189 of each subunit), the ECD only (green). Pale background reflects one standard deviation. (C) Distribution of tilt angles for the three helices in the trimer. (D) Probability density colored from white to red to black mapped onto the structure to show the lipid-protein interactions. (E) shows the key residues of the ECD that form interactions with the membrane. In both (D,E) different protein monomers are indicated in superscript.

