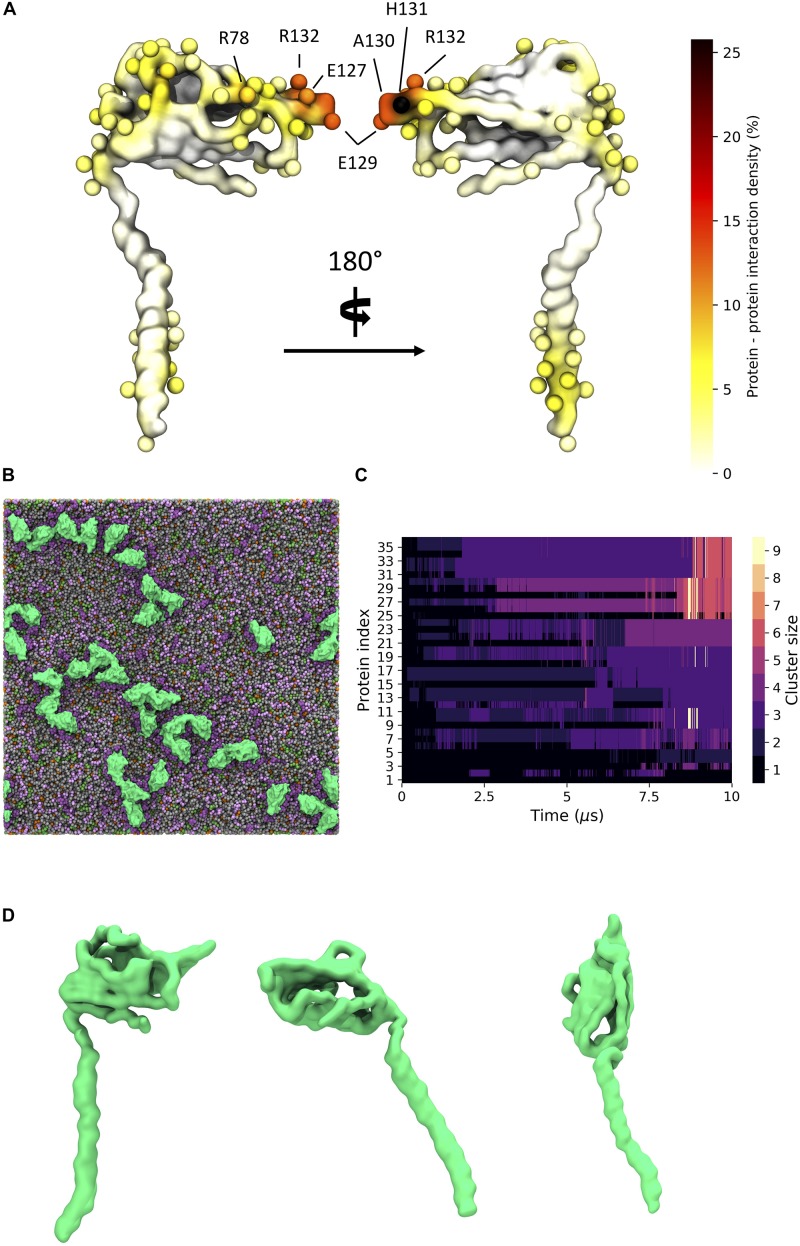
FIGURE 7.
β3 clustering in a general mammalian membrane. (A) Regions of high protein - protein contact visualized on the β3 subunit surface colored as a probability undergoing an interaction with another protein. Spheres indicate residues with total interactions above 2.5% of the total time. (B) Typical clustering of β3 subunits (green) in a mixed lipid membrane (viewed from the extracellular side). Lipids visible in the upper leaflet include POPC (gray), POPE (green), Sph (pink), GM3 (purple), and Chol (orange). (C) Evolution of β3 clusters over a 10 μs simulation. Lighter colors indicate higher order clusters. (D) Distinct conformations of the β3 subunit involved in clusters. From left to right: down, intermediate, and up states.

