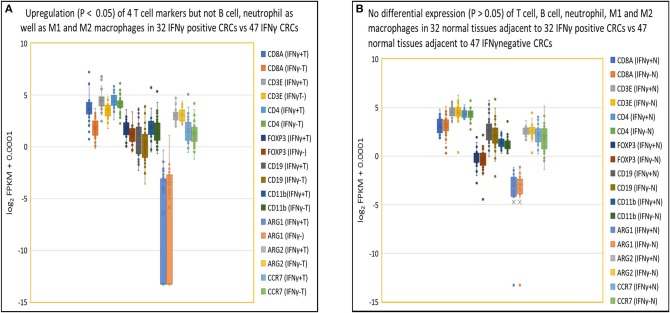
Figure 4.
Close association of IFNγ with T cells in tumor but not in normal tissues. (A) Box and Whisker plot of immune cell genes in IFNγ positive CRCs. Upregulation (P < 0.05) of T cells (CD8A, 3.5-fold; CD3E, 2.0-fold; CD4, 1.3-fold; FOXP3, 1.5-fold) but not B cell (CD19) (1.2-fold, P = 0.38), neutrophil (CD11b) (1.4-fold, P = 0.079), M1 (ARG1) (0.68-fold, P = 0.62), (ARG2) (1.0-fold, P = 0.87), or M2 (ARG2, CCR7) (1.2-fold, P = 0.30) leukocyte-related genes in IFNγ positive CRC vs. negative CRC. (B) Box and Whisker plot of immune cell genes in normal colon tissue. No upregulation (P > 0.05) of T cells (CD8A, 0.93-fold; CD3E, 1.0-fold; CD4, 1.0-fold; FOXP3, 1.1-fold), B cell (CD19) (1.4-fold), neutrophil (CD11b) (1.1-fold), MDSC1 (ARG1) (1.0-fold), (ARG2) (0.97-fold), or MDSC2 (ARG2, CCR7) (1.2-fold) leukocytes related genes in tissues adjacent to IFNγ positive and negative CRCs.

