
Figure 1.
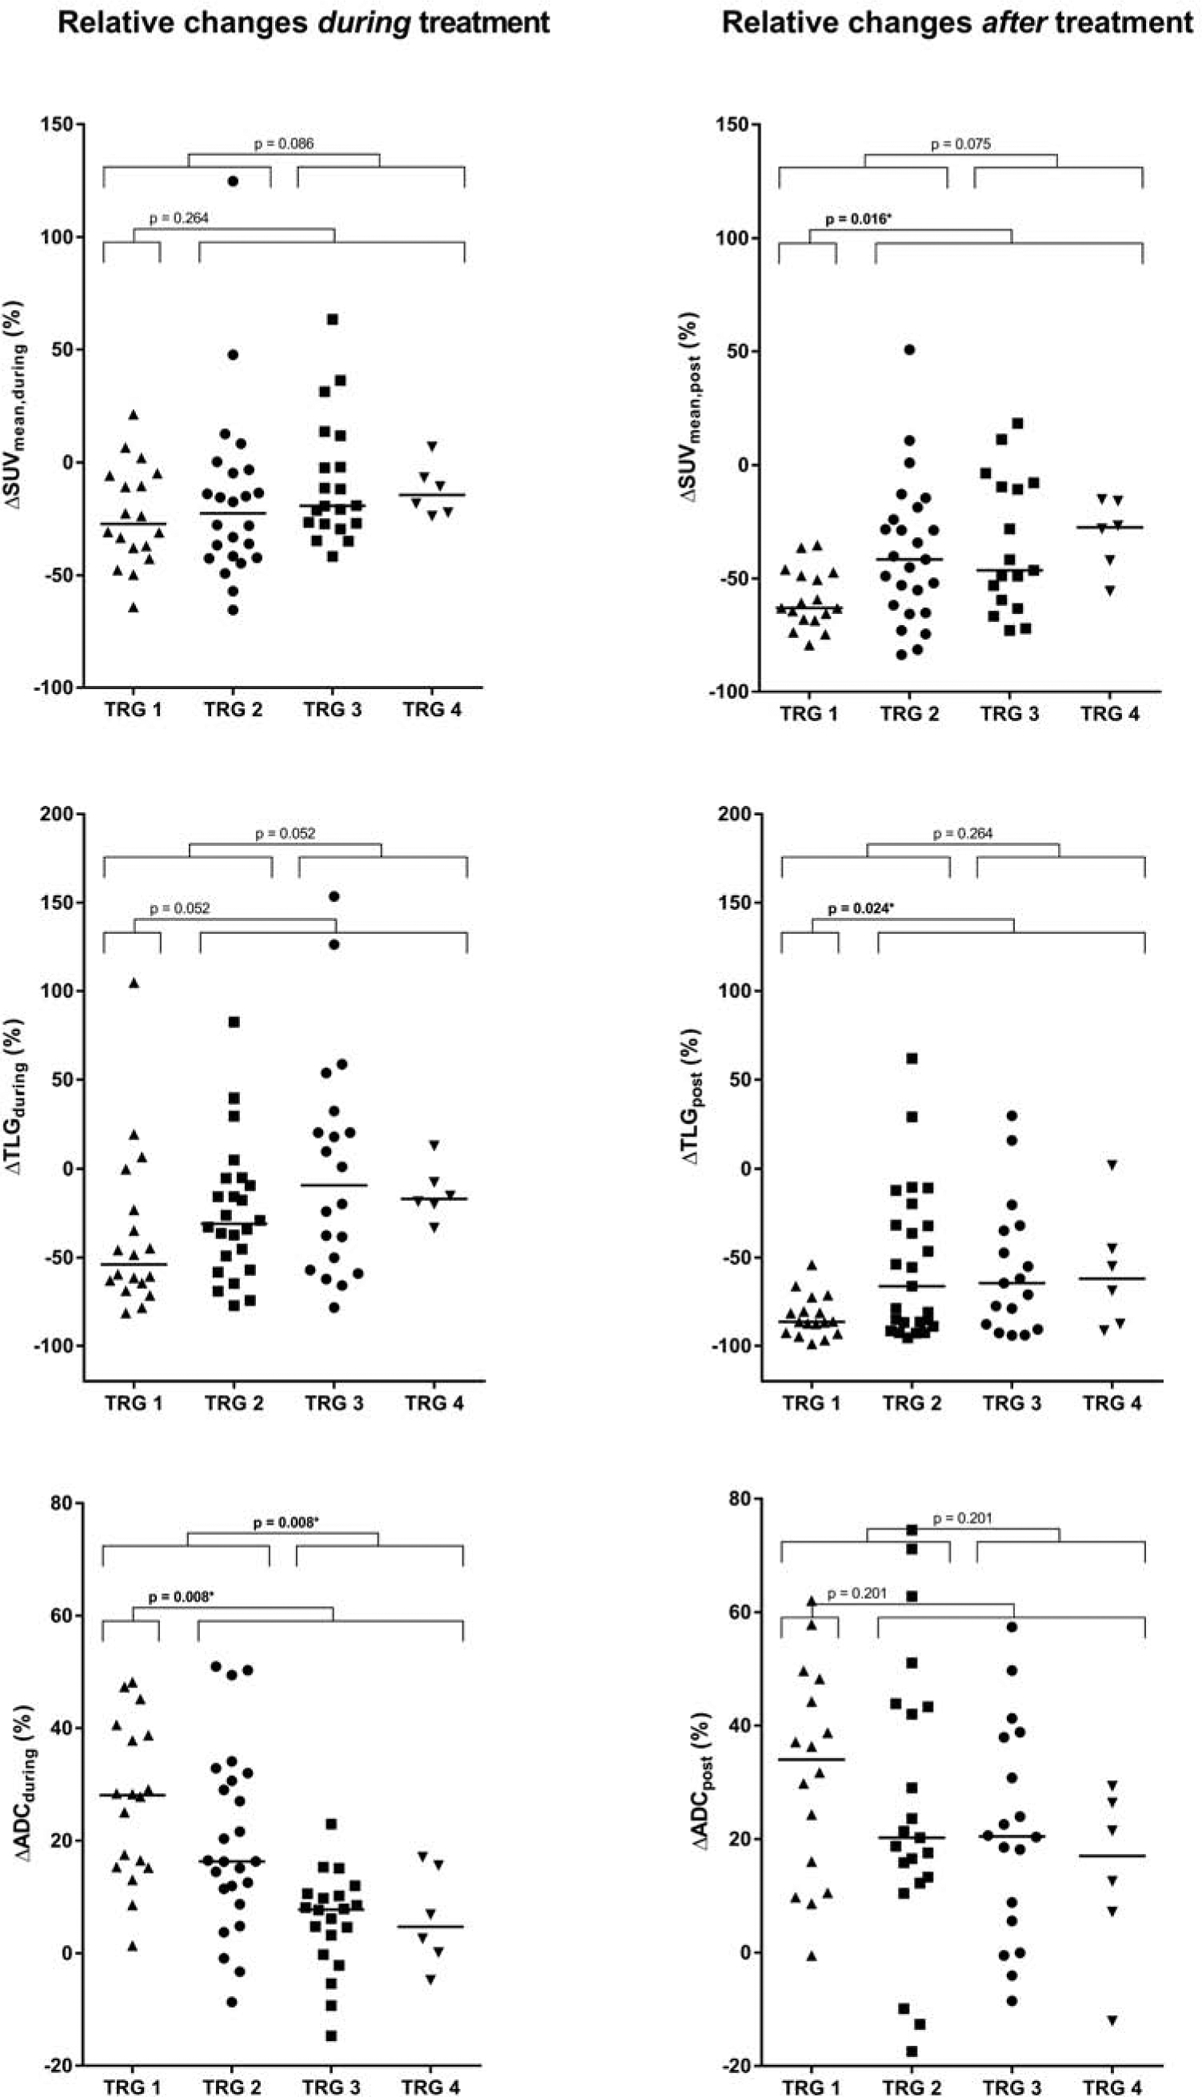
Relative changes in 18F-FDG PET/CT and DW-MRI parameters during and after neoadjuvant chemoradiotherapy in all patients, categorized by histopathologic tumor regression grades (TRG). The solid horizontal lines represent group medians. Significant differences between the groups based on the Mann-Whitney U test followed by Benjamini-Hochberg adjustment are marked with an asterisk (*).