
Figure 2.
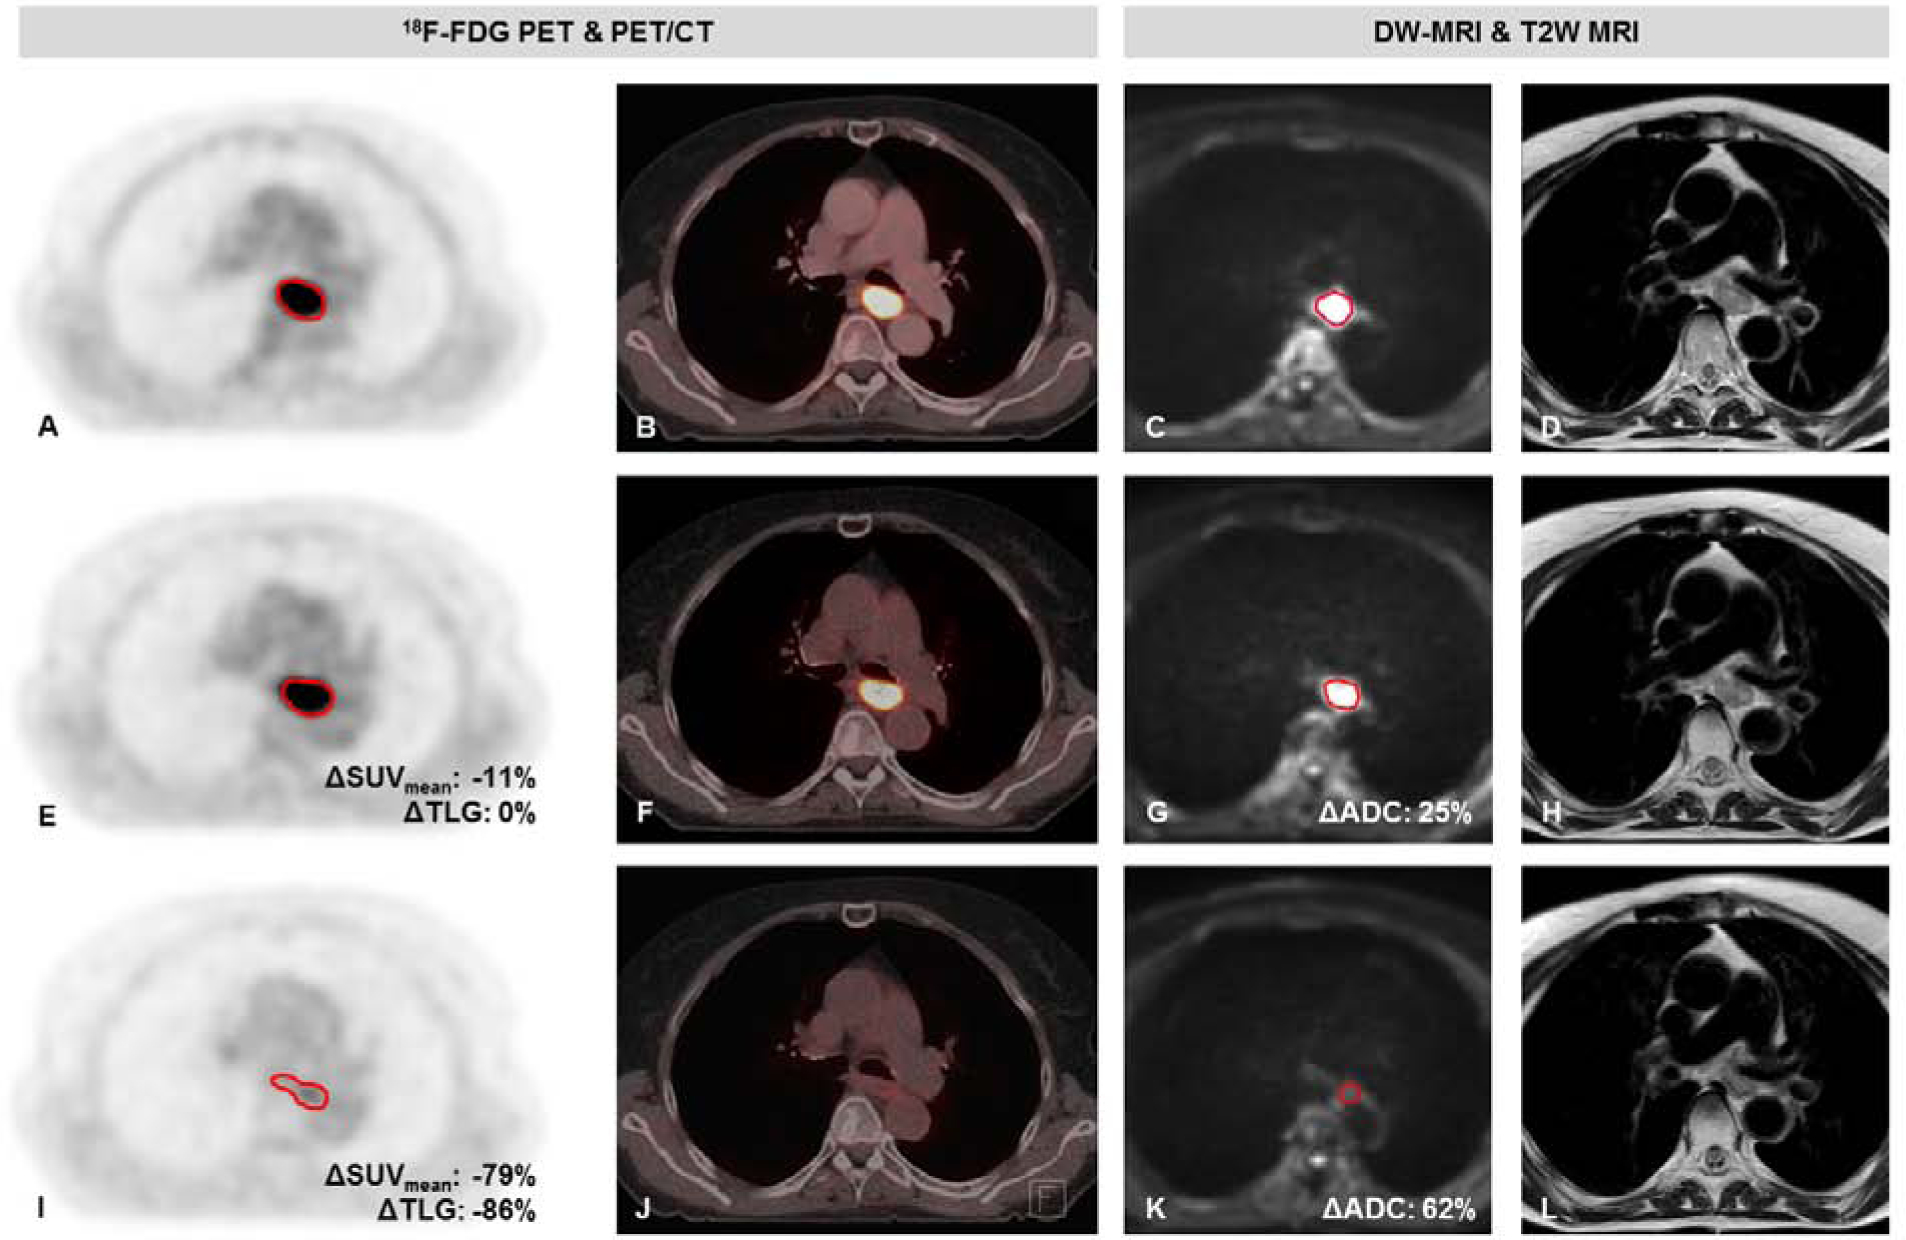
Patient with a cT3N2M0 mid-esophageal squamous cell carcinoma with a pathologic complete response to neoadjuvant chemoradiotherapy (TRG 1). 18F-FDG PET images (A, E, I), fused PET/CT images (B, F, J), diffusion-weighted images (b-value = 200 s/mm2) (C, G, K) and T2 weighted images (D, H, L) on a 1.5T MR scanner before neoadjuvant chemoradiotherapy (nCRT) (A-D), during nCRT (E-H), and after nCRT (I-L).