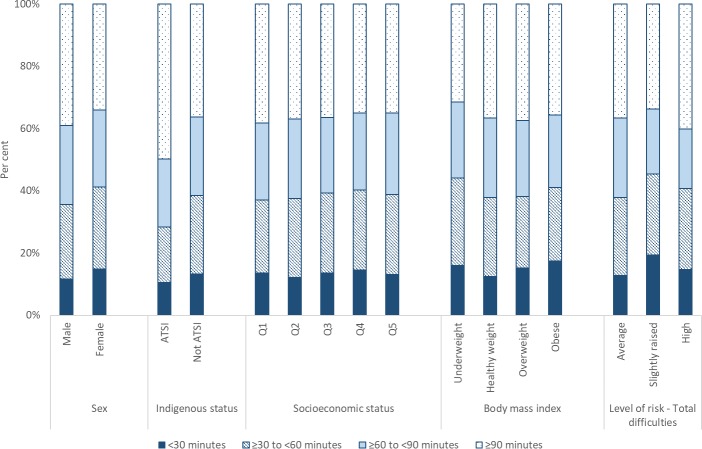
Figure 2.
Characteristics of children by average daily physical activity participation, 2014–2016. (a) Excludes children for whom Indigenous status was not available. (b) Socioeconomic status based on ACT quintiles of relative disadvantage from IRSD at SA1 level. Q1—most disadvantaged; Q5—least disadvantaged. Excludes children for whom socioeconomic status was not available. (c) Excludes those for whom body mass index not available. (d) Excludes those for whom physical activity participation not available. ACT, Australian Capital Territory; IRSD, Index of Relative Socio-Economic Disadvantage; SA1, Statistical Area Level 1.

