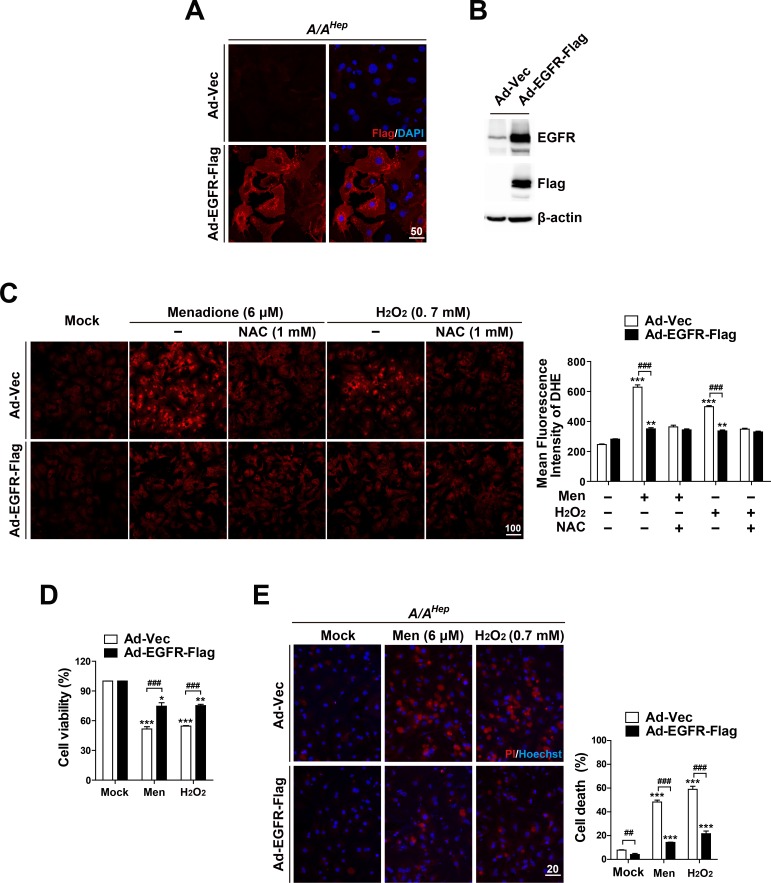
Fig. 5. EGFR overexpression reduces the susceptibility of eIF2α phosphorylation-deficient primary hepatocytes to reactive oxygen species.
(A) Primary hepatocytes isolated from A/AHep mice were infected with recombinant adenoviruses (100 multiplicity of infection) expressing EGFR-Flag (Ad-EGFR-Flag) or empty vector controls (Ad-Vec) for 12 h. The cells were fixed, stained with anti-Flag monoclonal antibody and DAPI, and examined by fluorescence microscopy (scale bar = 50 μm). (B) From Ad-EGFR-Flag or Ad-Vec infected A/AHep primary hepatocytes, the cell lysates were subjected to SDS-PAGE, followed by immunoblot analyses using antibodies specific for EGFR, Flag, and b-actin. (C) The Ad-EGFR-Flag or Ad-Vec infected A/AHep primary hepatocytes were treated with menadione (6 μM), menadione (6 μM) plus N-acetylcysteine (NAC, 1 mM), hydrogen peroxide (H2O2, 0.7 mM), or hydrogen peroxide (H2O2, 0.7 mM) plus N-acetylcysteine (NAC, 1 mM) for 20 h. The accumulated intracellular ROS were observed using fluorescence microscopy of the cells stained with dihydroethidium (DHE), reflecting ROS levels. Representative images are shown (scale bar = 100 μm). The mean fluorescence intensities (MFI) of DHE staining were measured using image analysis software. The data are expressed as the means ± SEMs of three independent experiments. **P < 0.01 and ***P < 0.001; Mock vs Chemicals in the same genotype, ### P < 0.001; Ad-Vec vs Ad-EGFR-Flag. (D and E) The Ad-EGFR-Flag or Ad-Vec infected A/AHep primary hepatocytes were treated with menadione (6 μM) or hydrogen peroxide (H2O2, 0.7 mM) for 30 h (D) and 18 h (E). Cell viability was determined using the crystal violet assay. The data are expressed as mean ± SEM of three independent experiments. Cell death (apoptotic and necrotic cells) was determined by double staining with Hoechst 33258 and propidium iodide (PI). Representative images are shown (scale bar = 20 μm). At least 500 cells were counted, and cell death is expressed as a percentage of total cells. The data are expressed as mean ± SEM of three independent experiments. *P < 0.05, **P < 0.01, and ***P < 0.001; Mock vs Chemicals in the same group, ## P < 0.01 and ### P < 0.001; Ad-Vec vs Ad-EGFR-Flag.

