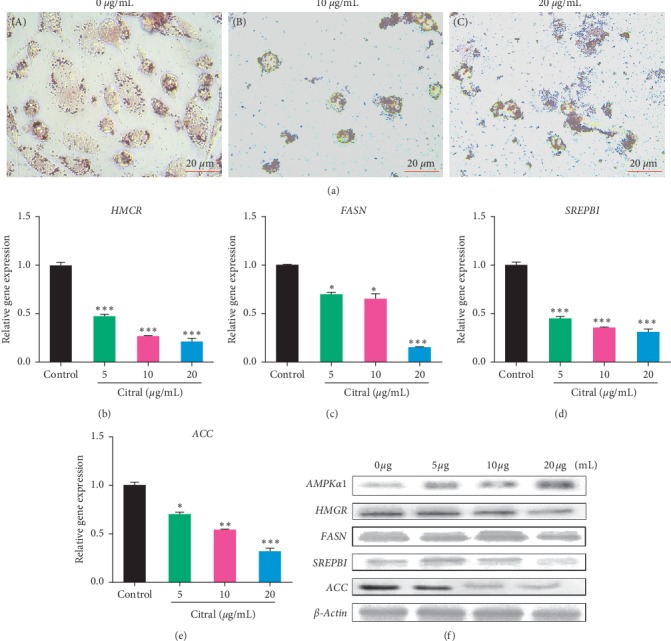
Figure 5.

Citral suppressed lipogenesis of prostate cancer cells. (a) Oil Red O staining was used to identify the lipid droplets in prostate cancer cells (PC3) with (65.7 and 131.4 µM) or without treatment. (b–e) The mRNA expression analysis of various transcripts involved in the lipogenesis pathway was quantified using qPCR analysis. The β-actin was used as an internal control. (f) The protein expression of AMPK-P, HMGR, FASN, SREBP1, and ACC was quantified using Western blotting. Each bar represents the mean ± standard error of triplicate samples from three independent experiments (p=0.05, using Student's t-test).
