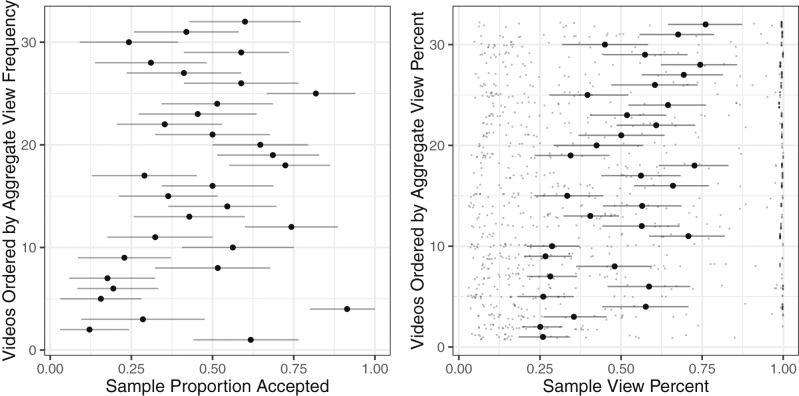
Fig. 2.
Sample and aggregate view choice and duration. Large points represent means. Error bars represent 95% CIs. Points represent data for each participant. Sample choices to watch videos were not significantly associated with aggregate view frequency (Left). Sample view percentage was positively associated with aggregate view duration (Right).

