Fig. 3.
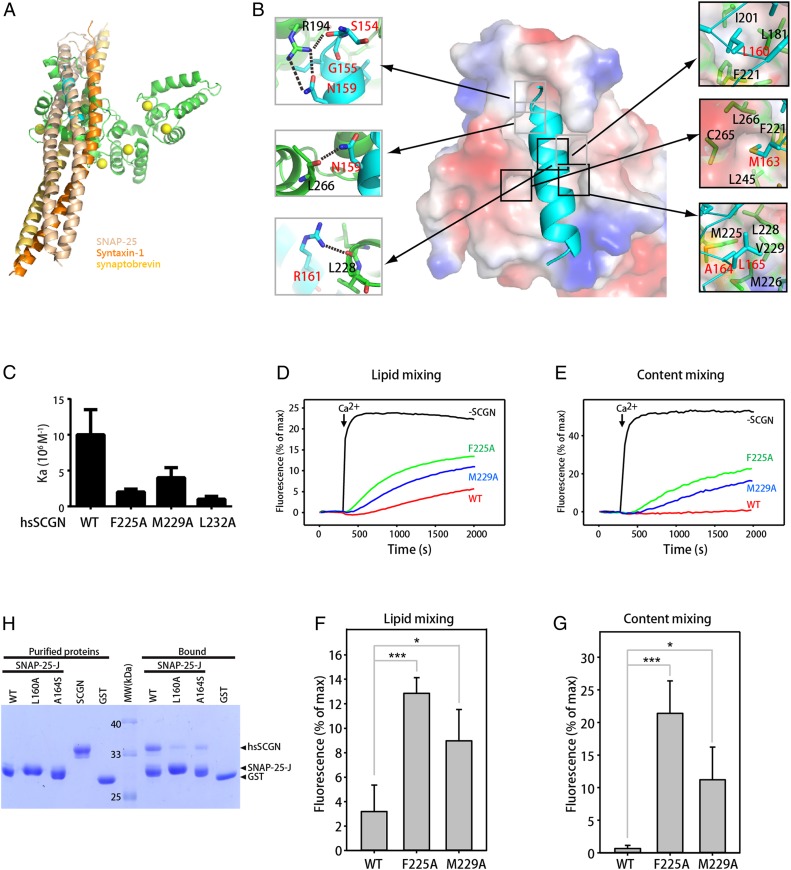
Residues of SNAP-25 that mediate SCGN binding are also involved in interactions with other SNAREs in the SNARE complex. (A) Overlay of the structure of the SCGN–SNAP-25 complex with that of the SNARE complex by superimposing the SNAP-25 peptide. Green: drSCGN; cyan: SNAP-25 peptide; wheat: SNAP-25 within the SNARE complex; yellow orange: synaptobrevin; orange: Syntaxin-1; yellow balls: calcium ions. (B) Detailed view of the interactions between domain III of drSCGN and the SNAP-25 peptide. drSCGN is shown in electrostatic potential surface representation (orientation identical to that of Fig. 2B), and SNAP-25 is shown in ribbon representation. Residues forming intramolecular hydrogen bonds (dashed line) and van der Waals’ interactions are shown on the left and right of the main figure, respectively. (C) Affinity between SNAP-25 J and human SCGN (hsSCGN) wild-type or mutants in the presence of 2 mM CaCl2, determined by ITC. Association constants (Ka) were measured from three independent titrations, and shown as mean ± SD. (D–E) Lipid mixing (D) between V- and T-liposomes was monitored from the fluorescence de-quenching of Marina blue lipids and content mixing (E) was monitored from the increase in the fluorescence signal of Cy5-streptavidin trapped in the V-liposomes caused by FRET with PhycoE-biotin trapped in the T-liposomes upon liposome fusion. Assays were performed with V- and T-liposomes in the presence of Munc18-1, M13C1C2BMUNC2C, NSF, αSNAP, and 1.5 μM wild-type, F225A or M229A SCGN. Experiments were started in the presence of 100 μM EGTA and 5 μM streptavidin, and Ca2+ (600 μM) was added at 300 s. (F and G) Quantification of the fusion assays shown in the figure. (D and E) Bars represent averages of the normalized fluorescence intensities observed in lipid mixing and content mixing assays at 2,000 s, performed in triplicates. Error bars represent SDs. Statistical significance and P values were determined by one-way analysis of variance (ANOVA) with Holm-Sidak test (*P < 0.05; ***P < 0.001). (H) GST pull-down assays performed with GST–SNAP-25 J wild-type or mutants, or GST, and purified hsSCGN, in the presence of 2 mM CaCl2 and 0.005% Triton X-100. After incubation with soluble proteins, the resin was extensively washed. The resin-bound proteins were then subjected to SDS/PAGE and Coomassie blue staining.

