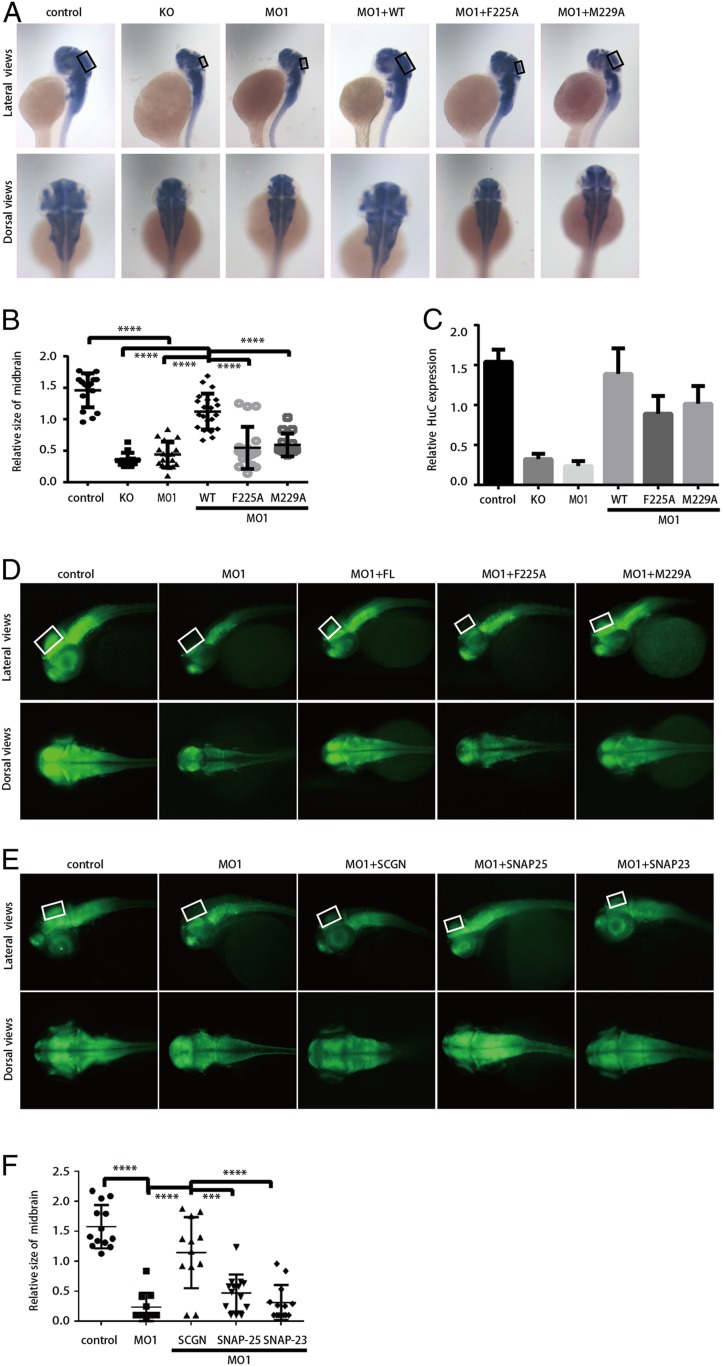
Fig. 7.
SCGN controls brain development in zebrafish through its interaction with SNAP-25 or SNAP-23. (A) WISH staining of HuC (elavl3) in zebrafish embryos at 48 hpf (80× magnification). KO: SCGN knockout; MO1: MO1 injection; MO1+WT, MO1 and hsSCGN wild-type mRNA coinjection; MO1+F225A: MO1 and hsSCGN F225A mutant mRNA coinjection; MO1+M229A: MO1 and hsSCGN M229A mutant mRNA coinjection; MO1+M230A/L232A: MO1 and hsSCGN M230A/L232A mutant mRNA coinjection. All injections were performed at one-cell stage of the development, together with p53 MO. The black rectangles label the position of midbrain. (A, Upper) Lateral view; (Lower) dorsal view. (B) Relative size of midbrain in zebrafish embryos, measured from A. Mean ± SD, ****P < 0.0001. P values were calculated using one-way ANOVA, Tukey's multiple comparisons test. (C) sqRT-PCR analysis of the relative transcription level of HuC. Mean ± SEM, n = 3. (D) HuC (green) expression in Tg[HuC: GFP] transgenic zebrafish (112× magnification). The white rectangles label the position of midbrain. (E) Tg[HuC: GFP] transgenic zebrafish was injected with control MO (control), or SCGN MO1 alone or together with mRNA encoding hsSCGN, SNAP-25, or SNAP-23. HuC expression was observed at 48 hpf (112× magnification). The white rectangles label the position of midbrain. (F) Relative size of midbrain in zebrafish embryos, measured from E. Mean ± SD, ****P < 0.0001; ***P < 0.001. P values were calculated using one-way ANOVA, Tukey’s multiple comparisons test.

