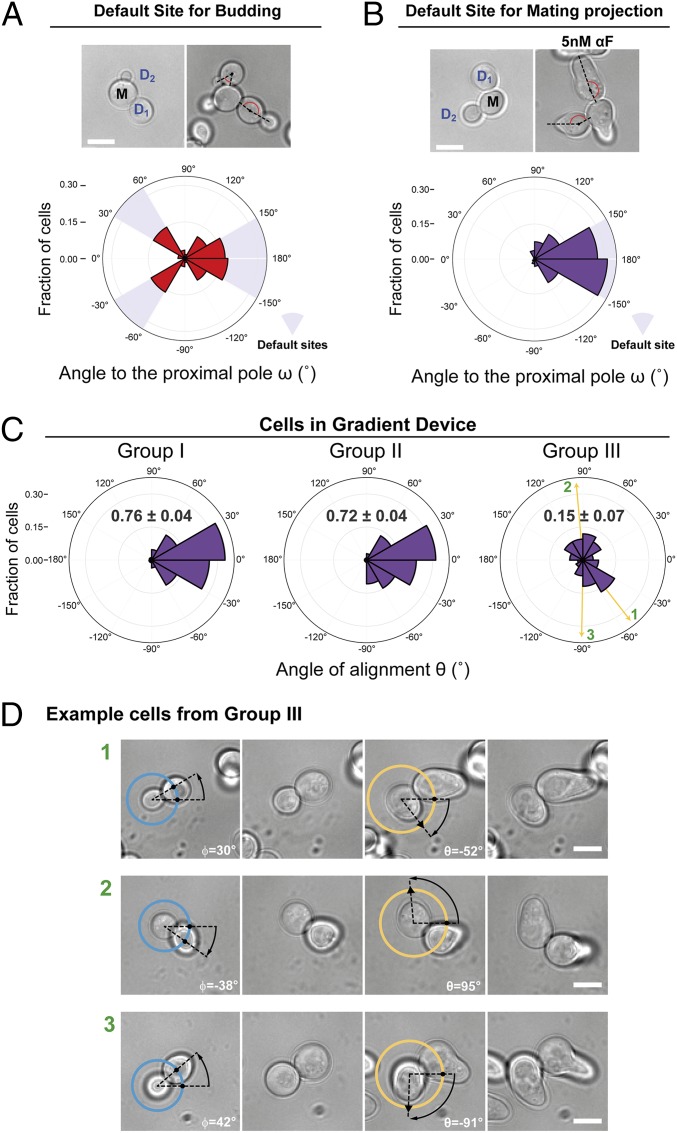
Fig. 2.
Internal polarity cues interfere with gradient sensing. (A and B) Budding and MP default sites used by the MATa Δbar1 strain ACL379. Yeast were imaged during vegetative growth or after stimulation with isotropic (no gradient) 5 nM α-factor (αF). In daughter cells, the angle between the proximal pole and the first bud or MP, ω, was measured as illustrated by the diagram (Fig. 1C). Images show the measurement of ω for two different daughter cells, D1 and D2. (Scale bar, 5 μm.) Polar plots show distributions of ω. Note the “no polarization zone” at angles between −30° and 30°. (C) Δbar1 cells (ACL379) were exposed to a gradient of α-factor in a microfluidic device. Daughter cells were divided into three groups depending on ϕ (Fig. 1C): group I, distal pole facing the gradient (|ϕ| > 120°); group II, distal pole perpendicular to the gradient (60° < |ϕ| < 120°); and group III, distal pole facing away from the gradient (|ϕ| < 60°). Polar plots show the distributions of θ, the angle of alignment, where 0° corresponds to perfect alignment. The mean cosθ ± SEM is indicated in each group. Arrows indicate the angles of alignment of the three cells shown in D. The data from four independent experiments were pooled (total number of cells: 270). (D) Examples of cells from group III. For each cell, ϕ and θ are indicated. The pheromone source is on the right. (Scale bar, 5 μm.)

