Fig. 4.
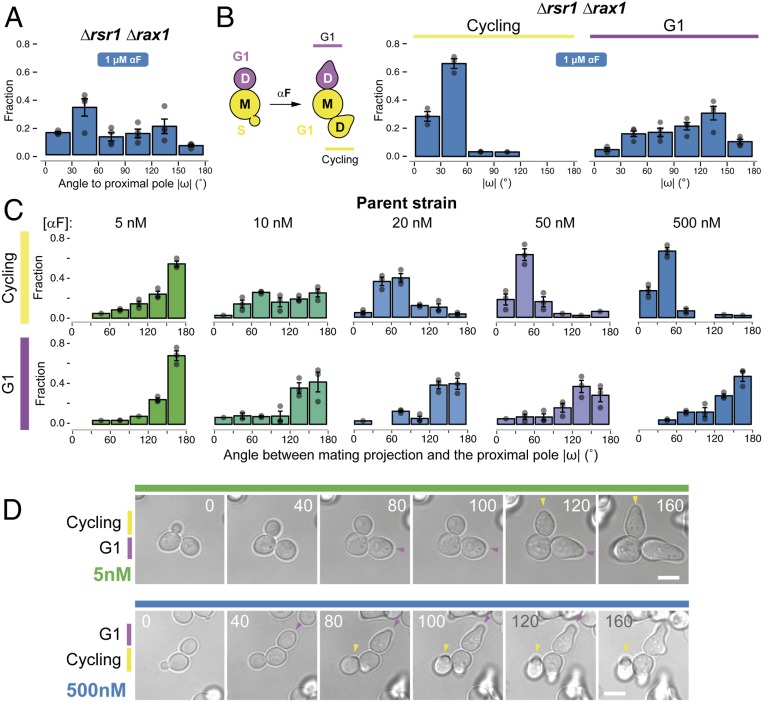
Default sites differ between G1 and cycling cells. (A) Exponential cultures of the Δrsr1 Δrax1 strain YGV5838 were subjected to live-cell imaging in the presence of 1 μM α-factor. The angle of the MP relative to the proximal pole (ω) was measured in daughter cells as in Fig. 3. (B, Left) Diagram illustrating classification into G1 and cycling daughter cells at the time of the addition of α-factor. (B, Right) Distribution of angle ω in cycling and G1 Δrsr1Δrax1 cells from A. (C) Distribution of angle ω in cycling and G1 cells of the ACL379 parent strain exposed to the indicated pheromone concentrations. Data from three independent experiments (points) were pooled to calculate the mean ± SEM (bars and whiskers). (D) Time-lapse images of ACL379 cells from C stimulated with 5 or 500 nM αF. Numbers correspond to time in minutes after pheromone addition. Arrowheads indicate the position of the MP. (Scale bar, 5 μm.)

