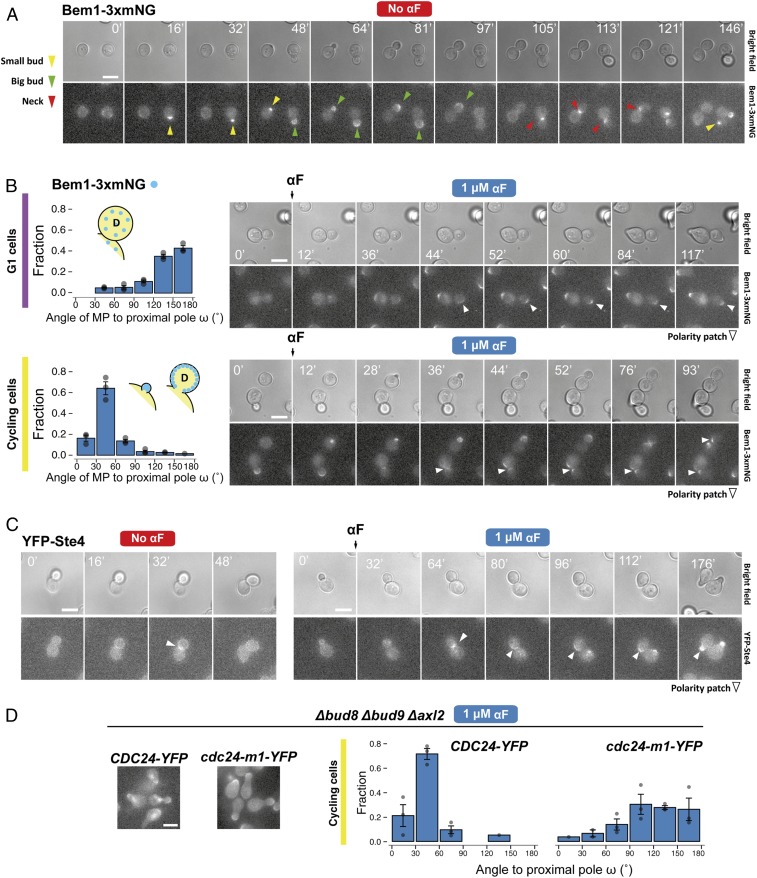
Fig. 5.
Polarity-patch dynamics during default MP site selection. (A) Time-lapse fluorescence microscopy of YGV5097 cells expressing Bem1-3xmNG (three copies of monomeric NeonGreen fluorescent protein in tandem) with different bud sizes (a proxy for cell-cycle position). Arrowhead colors indicate the different patterns of Bem1 localization: concentrated during apical growth of incipient and small buds (yellow), in the periphery of big buds during isotropic growth (green), and at the neck during cytokinesis (red). (B, Left) Distribution of MP angle ω in G1 (Top) and cycling (Bottom) Bem1-3xmNG cells. (B, Right) Dynamics of Bem1-3xmNG in typical G1 (Top) and cycling (Bottom) cells exposed to 1 μM α-factor. Arrowheads mark the location of the Bem1 patch. (C) Time-lapse images of cells expressing N-terminally YFP-tagged Ste4 (TCY3064) in vegetative growth (“No αF”) or after exposure to 1 μM αF. In A, B, and C, times of image acquisition are indicated in minutes. (D) Distribution of MP angle ω in cycling Δbud8 Δbud9 Δaxl2 cells expressing Cdc24-YFP (YGV6097) or Cdc24-m1-YFP (YGV6100) after exposure to 1 μM αF. Images illustrate the localization of Cdc24-YFP and Cdc24-m1-YFP after 2 h of exposure to αF. Note the absence of nuclear Cdc24-YFP in the m1 mutant due to the interrupted interaction with Far1. (Scale bars, 5 μm.)

