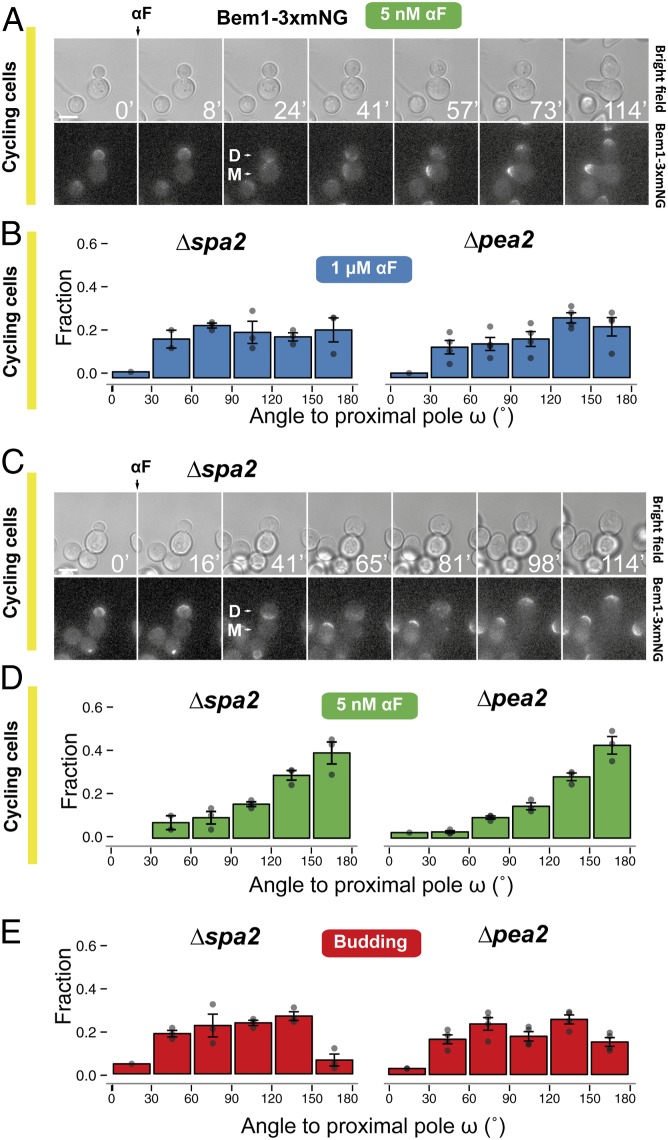
Fig. 6.
Participation of the cytokinesis-related polarity patch in selection of MP sites. (A) Dynamics of Bem1-3xmNG localization followed by live-cell fluorescence microscopy in the parental strain (YGV5097) exposed to 5 nM α-factor. Times are in minutes. “D” marks the daughter and “M” the mother cell. (Scale bar, 5 μm.) (B) Distributions of MP angle ω in cycling Δspa2 (YRB3862) and Δpea2 (YRB3865) daughters exposed to 1 μM α-factor. Data from three independent experiments (points) were pooled to calculate the means ± SEMs (bars and whiskers). (C) As in A, dynamics of Bem1-3xmNG localization in Δspa2 (YGV5836) stimulated with 1 μM α-factor. (D) Distributions of MP angle ω in cycling Δspa2 (YRB3862) and Δpea2 (YRB3865) cells exposed to 5 nM α-factor. (E) Distributions of first-bud angle ω in Δspa2 (YRB3862) and Δpea2 (YRB3865) cells growing vegetatively.

