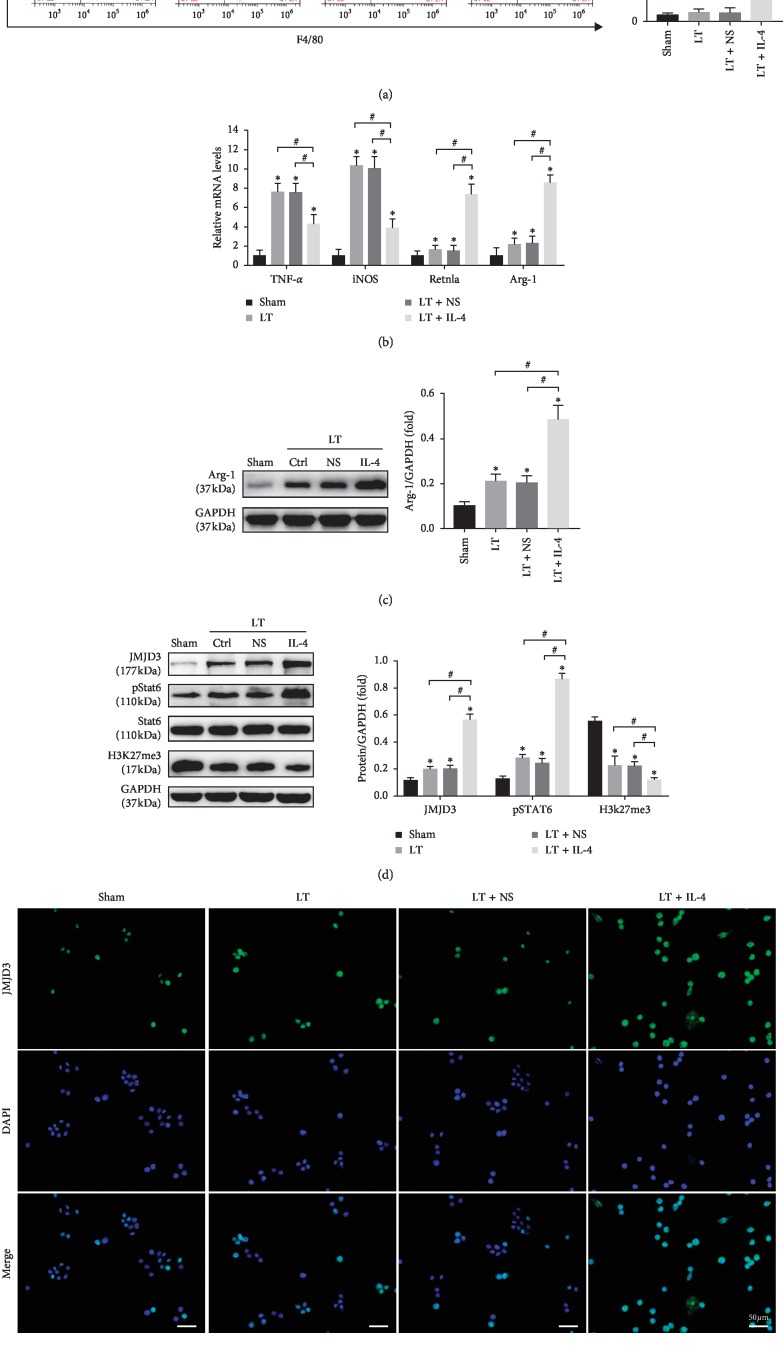
Figure 3.
IL-4 treatment induced KCs M2 polarization and increased the expression of JMJD3 in vivo. KCs were isolated from the Sham group, LT group, LT + NS group, and LT + IL-4 group at 6 h after liver transplantation. (a) The ratio of F4/80+CD206+ KCs was measured by flow cytometry. (b) The mRNA levels of KC marker genes, including TNF-α, iNOS, Arg-1, and Retnla, were detected by qRT-PCR. (c) The protein expression level of Arg-1 was tested by Western blot (n = 3/group). (d) The protein expression levels of JMJD3, p-STAT6, STAT6, and H3K27me3 in KCs were measured by Western blot. GAPDH served as an internal control and was used for normalization (n = 3/group). (e) The expression of JMJD3 (green) in KCs was detected by cell immunofluorescence, and DAPI (blue) was used for nuclear staining. Data are shown as mean ± SD, ∗p < 0.05vs. the Sham group, #p < 0.05vs. the LT + IL-4 group.

