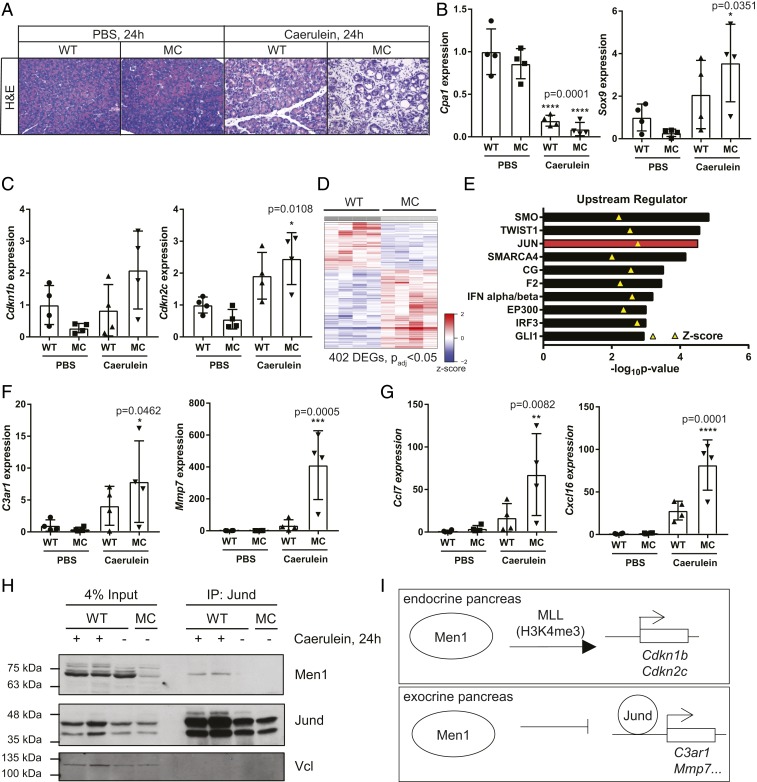
Fig. 3.
Molecular response to acute pancreatitis 24 h following treatment. (A) Representative images of pancreas histology 24 h following the final treatment. Images are at 20×. (Scale bar, 100 μm.) (B) qRT-PCR analysis of relative expression of Cpa1 (acinar) and Sox9 (ductal) gene. (C) qRT-PCR analysis of relative expression of Men1/MLL target genes, Cdkn1b and Cdkn2c. (D) Heatmap depicting differentially expressed genes in MC pancreas compared to WT control following chronic pancreatitis. (E) Ingenuity Upstream Regulator Analysis of RNA-sequencing data from chronic caerulein-inducted pancreatitis. The top 10 most significant predicted activators are presented. Z-score indicated with yellow triangle. (F) qRT-PCR analysis of genes identified as JUN targets in the analysis in D 24 h following acute caerulein-induced pancreatitis. (G) qRT-PCR validation of independent Jund target genes, Ccl7 and Cxcl16, 24 h following acute caerulein-induced pancreatitis. (H) Coimmunoprecipitation of Men1 with Jund. (I) Model of important Men1 functions in the endocrine and exocrine pancreas, respectively. All data are presented as mean ± SD from individual mice, relative to PBS-treated WT controls. Statistical analysis of gene expression was conducted with ANOVA with Dunnett’s multiple comparisons test to compare experimental samples to PBS-treated WT controls.

