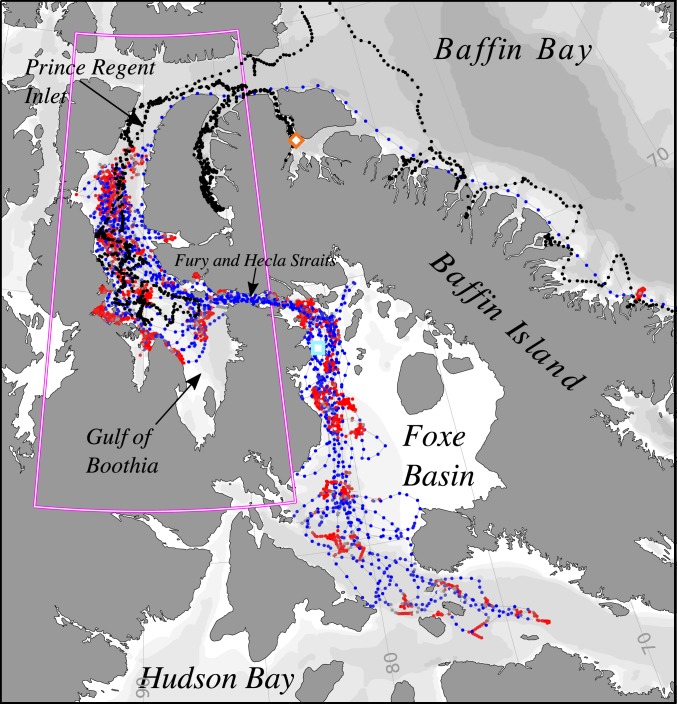
Fig. 1.
SSM fitted tracks of the three killer whales and seven bowhead whales. The fitted killer whale track (black dots) did not change states and represents the movements of the three whales, which followed nearly identical paths. The color of bowhead tracks represents SSM fitted behavioral states, with red showing inferred resident behavior, and blue showing inferred transit behavior. Lower-intensity colors indicate less certain behavioral states, with white being completely uncertain. The orange diamond indicates the location of killer whale tag deployments, and the cyan square indicates the location of bowhead whale tag deployments. See Movie S1 for a dynamic movie of predator−prey interactions and their interactions with sea ice. The magenta box surrounds the Gulf of Boothia, where interactions took place, and represents the area shown in Fig. 4.

