Fig. 3.
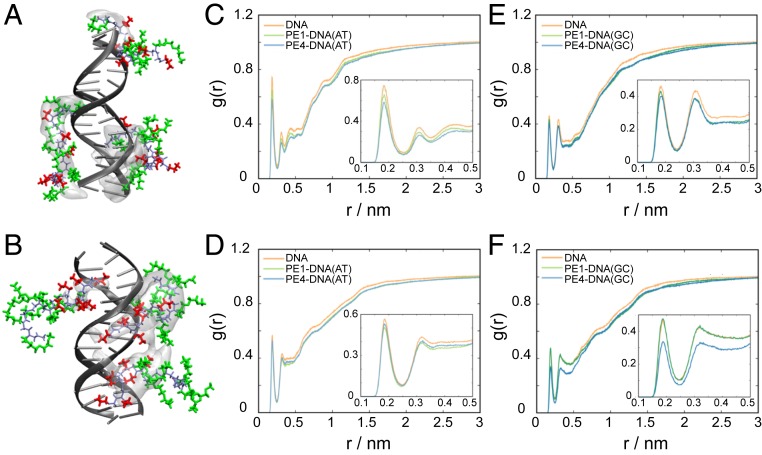
MD simulations of the interactions of PE1 and PE4 with dsDNA. (A and B) Molecular representation of the most visited binding sites and structures of PE1 (A) and PE4 (B) with dsDNA (blue, peptoid backbone; orange, Nae residues; green, Nte residues). The most visited binding sites are represented as occupancy volume areas (shown as transparent white), where the peptoids are present for at least 6% of total contact time. (C–F) RDFs of water near the minor (C and D) and major (E and F) grooves of the dsDNA. RDFs were calculated on the H (donor) atoms of water and the N and O (acceptor) atoms of AT (C and E) and GC (D and F) base pairs. The structuring of water around pristine DNA is shown in orange, and the dsDNA/PE1 and dsDNA/PE4 complexes are shown in green and blue, where the AT and GC base pairs are distinguished by light and dark colors, respectively. The Insets show a magnified representation of the first two peaks of the RDF results.

