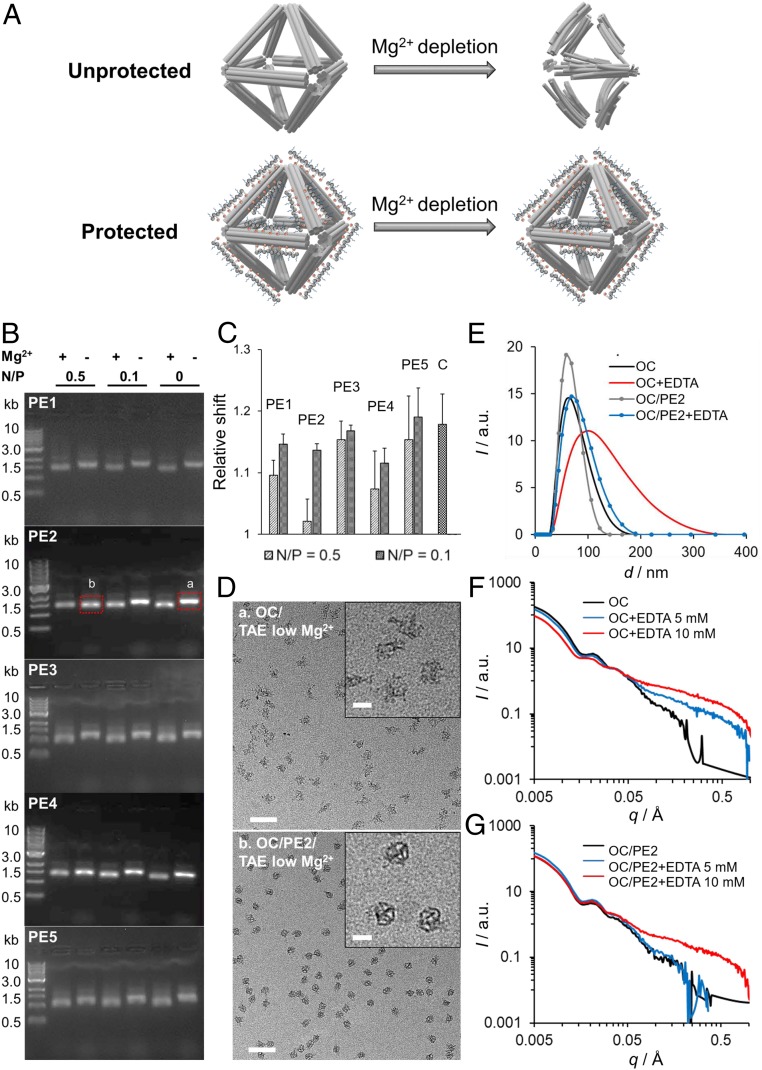
Fig. 4.
Analysis of peptoid-coated OCs in low-Mg2+ solution. (A) Schematic view showing peptoid-coated OCs (OC/peptoid) protection against Mg2+ depletion. (B and C) AGE was used to analyze the structural integrity of OCs in TAE buffer at MgCl2 concentrations of 12.5 mM (+) and 1.25 mM (−). In C, the electrophoretic shift was measured from the reference band at 0.5 kb and the relative value was calculated from that of the control OCs (n = 3). (D) TEM imaging was performed on OCs extracted from the agarose gels (bands a and b in B). (Scale bars, 200 nm.) D, Insets show magnified images of the OC structures. (Scale bars, 100 nm.) (E and F) DLS (E) and in situ SAXS (F) spectra for bare OC and OC/PE2 systems treated with EDTA (5 or 10 mM) for 20 to 30 min at room temperature. a.u., arbitrary units.

