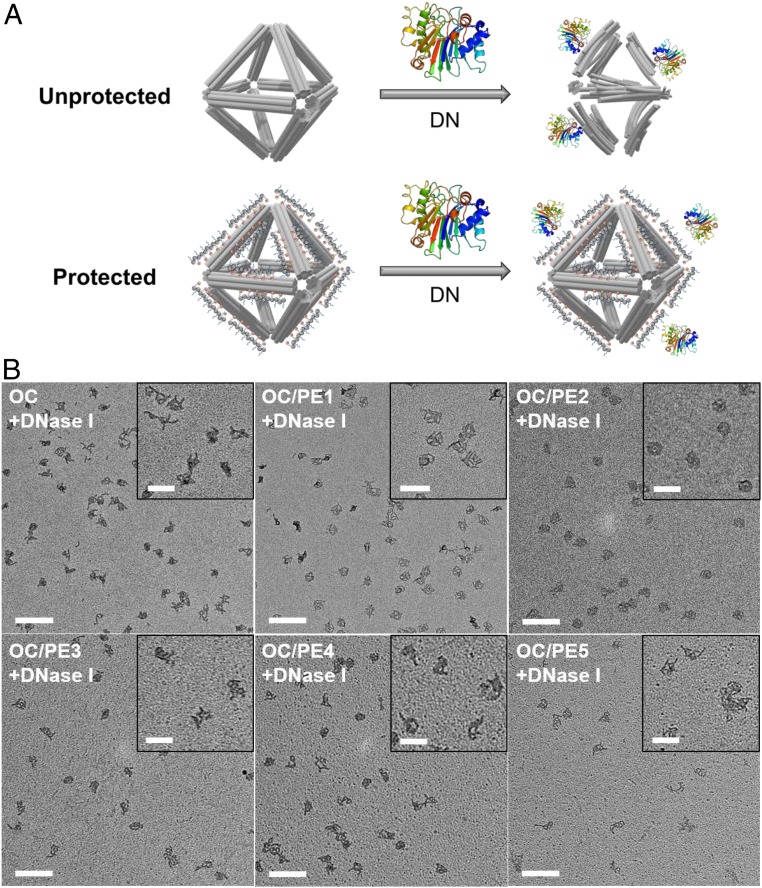
Fig. 5.
Structural analysis of peptoid-coated OCs in the presence of DNase. (A) Schematic view showing peptoid-coated OCs (OC/peptoid) protected against DNase I degradation. Adapted with permission from PDB ID: 2DNJ (68). (B) TEM images show bare OC and OC/peptoid structures (N/P: 0.5) in solution containing DNase I concentration of 15 µg/mL TEM imaging was performed on samples extracted from the agarose gel. (Scale bars, 200 nm.) B, Insets show magnified images of the OC structures. (Scale bars, 100 nm.)

