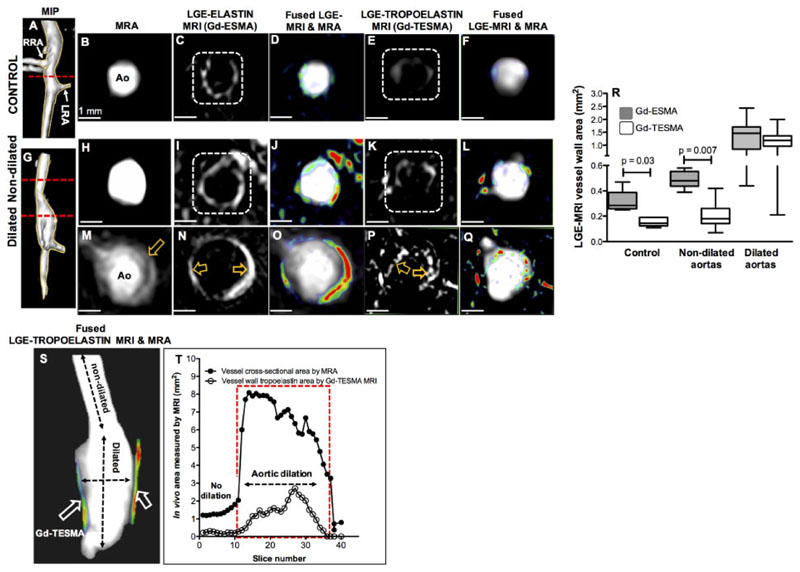
Figure 1. Gd-TESMA MRI demonstrates elevated tropoelastin expression confined to dilated aortic segments.
(A–Q) MRA and LGE-MRI of a control (A–F) and an Ang II-infused ApoE-/- mouse with aortic dilation (G–Q) scanned with the elastin (B–D, H–J, and M–O) and 24 h later the tropoelastin contrast agents (E and F; K and L; and P and Q). (R). Box–whisker plots of the LGE-MRI area shows that, unlike Gd-ESMA, the uptake of Gd-TESMA is specific for dilated segments (n = 14) of the aorta, consistent with dysfunctional matrix turnover in these regions, and is low in control (n = 5) and Ang II-infused mice without dilation (n = 6). Quantitative data were analysed by a Wilcoxon signed rank test for paired samples. (S and T) Fusion of reformatted MRA and LGE-MRI images from an Ang II-infused ApoE-/- mouse, after administration of Gd-TESMA, and graph show that the uptake of the tropoelastin contrast agent is confined within the dilated wall. Ao, aorta; LRA: left renal artery; MIP, maximum intensity projection; RRA, right renal artery.

