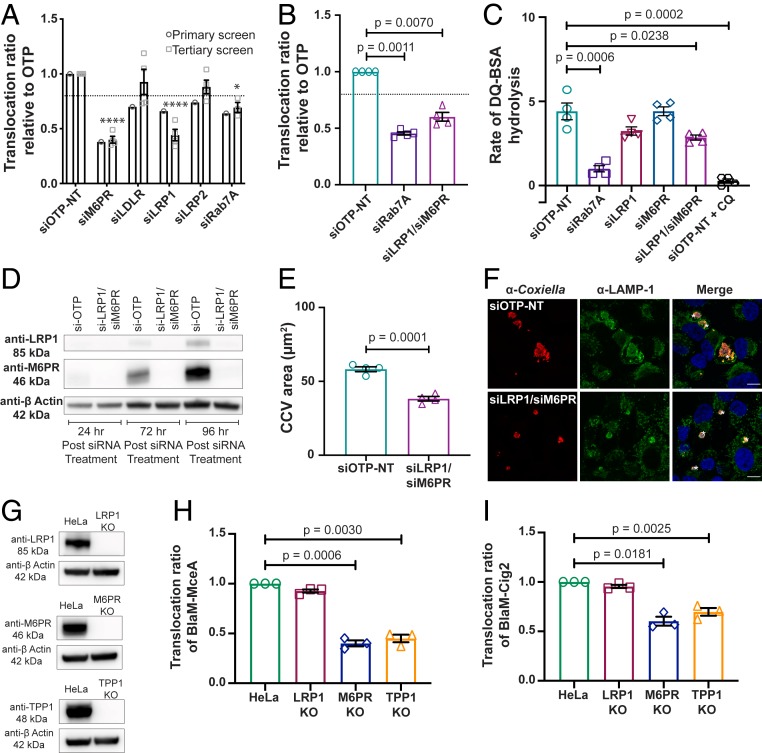
Fig. 2.
Examination of the role of the lysosomal receptors LRP1 and M6PR and lysosomal protease TPP1 during C. burnetii infection. (A and B) Effector translocation was determined using CCF2-AM in HeLa cells infected with C. burnetii pBlaM–MceA following transfection with siRNA SMARTpools for 72 h. Results are expressed relative to the nontargeting control (siOTP-NT), with error bars indicating SEM from at least three independent experiments. Statistical difference between tested siRNA and siOTP-NT was determined using one-way ANOVA, followed by Dunnett’s multiple-comparison posttest on raw data. ****P = 0.0001, *P < 0.05. The dotted lines indicate a translocation ratio of 0.8 relative to siOTP-NT. The outcome from the automated primary screen (circle) is shown for comparison in A. (C) Lysosomal protease activity of HeLa cells transfected with siRNA SMARTpools for 72 h was determined using DQ Green BSA. Results are expressed as the average linear rate of DQ-BSA hydrolysis for each condition (12 wells in a 96-well plate) over 2 h from at least three independent experiments. Error bars denote SEM. Statistical difference between tested siRNA and siOTP-NT was determined using an unpaired, two-tailed t test on raw data. CQ, chloroquine. (D) Immunoblot analysis of cell lysates from HeLa cells treated with siRNA SMARTpools collected at 24, 72, and 96 h post siRNA treatment. The absence of protein expression in siRNA-treated cells compared with siOTP-NT–treated cells was confirmed using anti-LRP1 (Top) and anti-M6PR (Middle) antibodies. Anti–β-actin was used as a loading control (Bottom). (E) Intracellular replication of C. burnetii in HeLa cells treated with siRNA SMARTpools and subsequently infected with C. burnetii at an MOI of 50 for 3 d. Results are expressed as the average CCV area (µm2) from four experiments with at least 50 CCVs measured per experiment. Error bars represent SEM. Statistical difference between siOTP-NT and tested siRNA was determined using an unpaired, two-tailed t test on raw data. (F) Representative confocal micrograph images of siRNA-treated HeLa cells infected for 3 d with C. burnetii used to quantify CCV area in E. Cells were stained with anti-Coxiella antibody (red), anti–LAMP-1 antibody (green), and DAPI (blue). (Scale bars, 10 µm.) Asterisks indicate CCV. (G) Immunoblot analysis of cell lysates from HeLa parent cells and LRP1 KO cells (Top), M6PR KO cells (Middle), and TPP1 KO cells (Bottom) illustrating the absence of protein expression in the KO cells using anti-LRP1, anti-M6PR, and anti-TPP1 antibodies, respectively. Anti–β-actin was used as a loading control. (H and I) Effector translocation was measured in KO cell lines infected with either C. burnetii pBlaM–MceA (H) or C. burnetii pBlaM–Cig2 (I). Results are expressed relative to HeLa cells, with error bars denoting SEM from three independent experiments. Statistical difference between HeLa and KO cell lines was determined using one-way ANOVA, followed by Dunnett’s multiple-comparison posttest on raw data.

