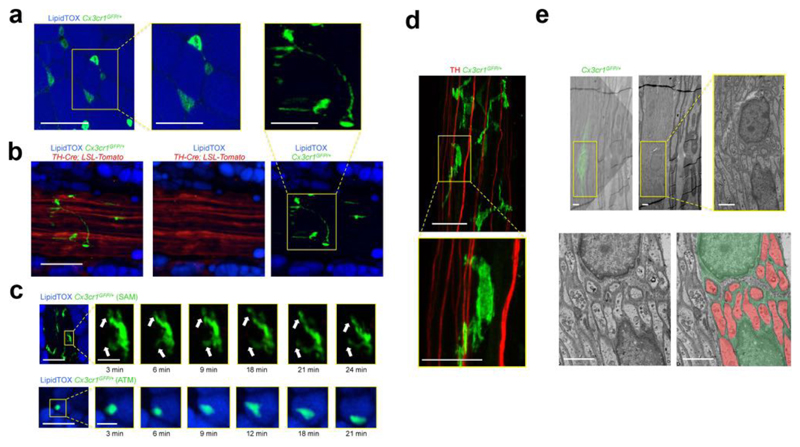
Figure 1. Sympathetic neuron-associated Cx3cr1GFP/+ cells exhibit differentiated morphology for specific association with SNS neurons.
(a) Confocal images from white adipose tissue isolated from Cx3cr1GFP/+ mice and stained using lipid stain LipidTOX (blue) and anti-GFP (green) antibody. Images are representative of 5 similar experiments. (b) Confocal images of sympathetic nerve fibers in subcutaneous adipose tissue isolated from TH-Cre; LSL-Tomato (red) / Cx3cr1GFP/+ (green) mice and stained using lipid stain LipidTOX (blue). Images are representative of 3 similar experiments. Scale bars in a and b, 50 μm. Boxed regions in a and b represent higher magnification of the main micrographs - scale bars, 25 μm (c) Intra-vital multi-photon visualization of a neuro-adipose connection in the inguinal fat pad of a live Cx3cr1GFP/+ mouse; LipidTOX (blue) labels adipocytes. Images are depicting morphological features and cell dynamics of Cx3cr1GFP/+ cells associated with sympathetic nerve fibers (upper panels) and Cx3cr1GFP/+ cells in the parenchyma of subcutaneous fat (lower panels). Images are representative of 3 similar experiments. Scale bars, 50 μm. Boxed regions represent higher magnification of the main micrograph at time points indicated below micrographs – scale bars, 10 μm. (d) Confocal images from sympathetic nerve fibers isolated from inguinal fat pad of Cx3cr1GFP/+ mice and stained using anti-TH (red) and anti-GFP (green) antibodies. Images are representative of 5 similar experiments. Scale bar, 50 μm. Boxed region represents higher magnification of the main micrograph – scale bar, 25 μm. (e) Correlative confocal and transmission electron microscopy of the nerve fibers isolated from subcutaneous fat pad of Cx3cr1GFP/+ mice. Shown is an overlay of the Cx3cr1GFP/+ fluorescence (green) with the electron micrograph from the same section, (upper left with the lower left panel being a higher magnification), electron micrograph alone (upper middle with the yellow boxed region in the right panel being a higher magnification), and electron micrograph (lower left) with false color-coding of the same image highlighting Cx3cr1GFP/+ cells (green) and sympathetic nerves (red) (lower right). Images are representative of 2 similar experiments. Scale bars, 2 μm.

