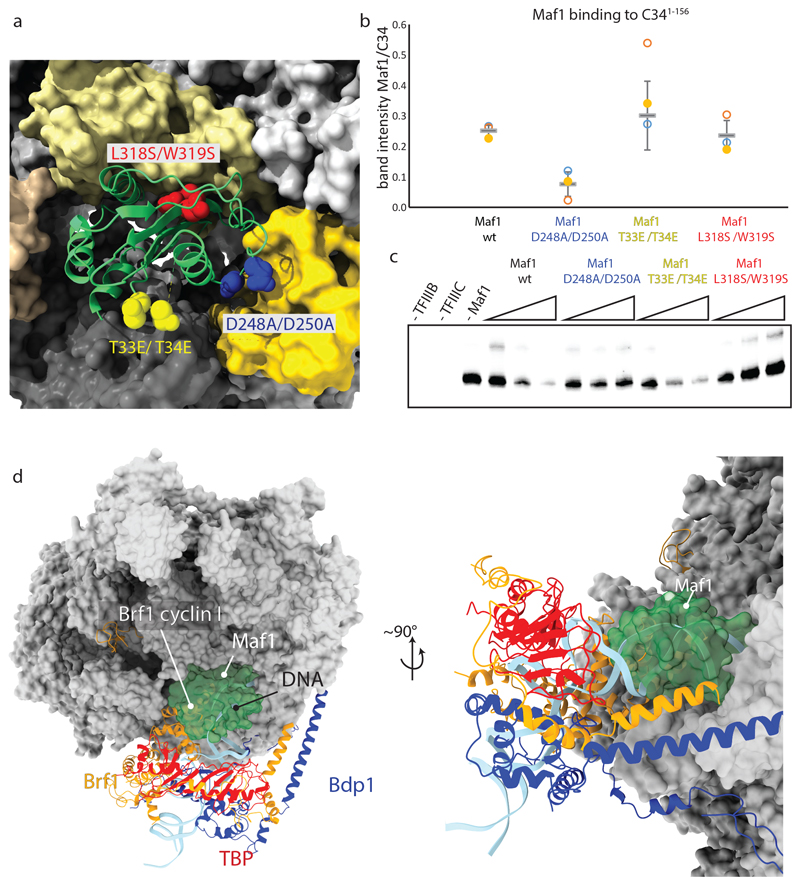
Fig. 2. Structure-guided mutagenesis confirms the mechanism of transcription inhibition.
a, Location of the introduced mutations. b, Quantification of Maf1-id binding to C34 1-156 as determined from three independent pull-down experiments. The centerlines represent the mean and vertical error bars represent the standard deviation of the mean. c, In vitro transcription assay using the His-tDNA template comparing inhibition efficiency of Maf1-id wt and Maf1-id mutant proteins. Data for panels b and c are available as source data. d, Maf1 clashes with TFIIIB and DNA in the PIC. Superposition of the Maf1-Pol III structure reported here and the Pol III pre-initiation complex (PDB 6F40) in two views. Maf1 is shown in green transparent surface and TFIIIB and promoter DNA in ribbon representation.

