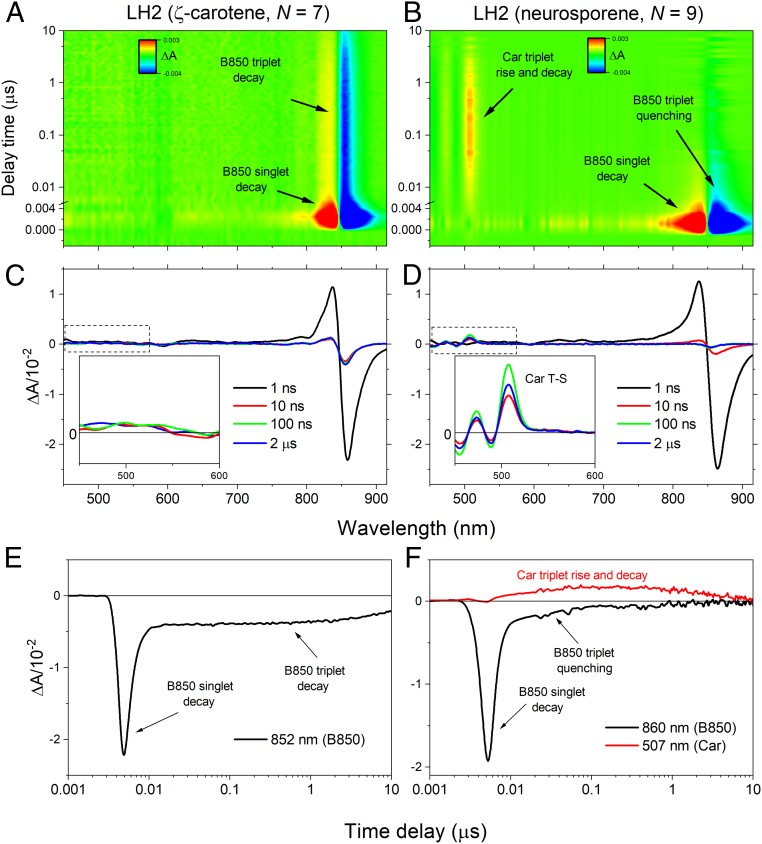
Fig. 4.
TA of the ζ-carotene–containing LH2 complex over a microsecond time range and comparison with neurosporene-containing LH2. (A and B) Pseudocolor contours of the TA for both LH2 complexes obtained after excitation of the Car band. Noticeable transient bands are marked. (C and D) Individual TA spectra recorded at various delay times after the excitation. (Insets) TA in the spectral range in which triplet-minus-singlet (T-S) spectra of the Car appear. (E and F) Representative TA kinetic traces recorded at the bleaching of B850 Qy band (852 and 868 nm) and at the maximum of the Car T1 → Tn ESA band (507 nm, neurosporene-containg LH2 only). For clarity, time delays are plotted on a log scale and are slightly offset from t0 = 0.

