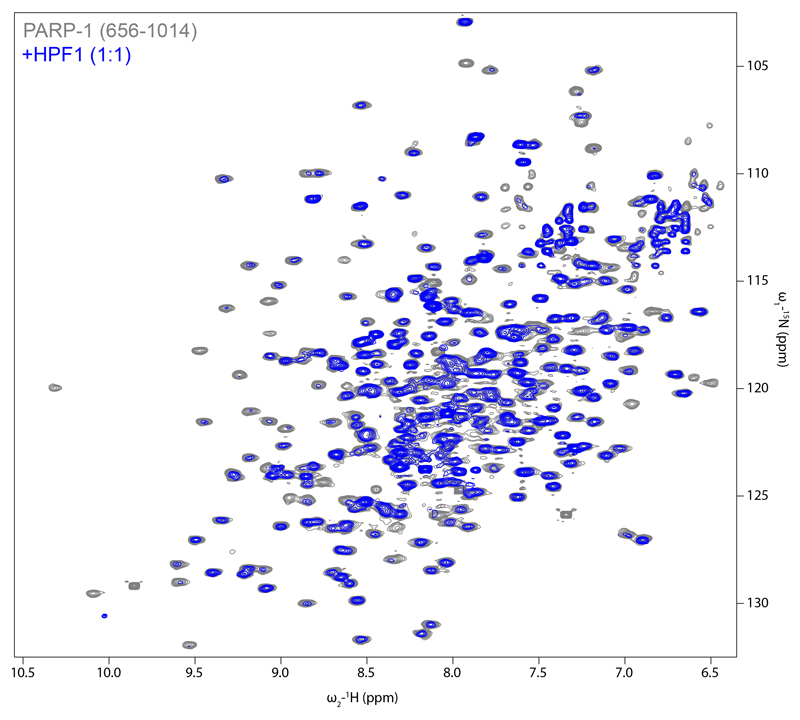
Extended Data Figure 7. [15N,1H] TROSY spectra of PARP1 CAT +/- HPF1.
[15N,1H] TROSY spectra of human PARP1656-1014 in the absence (grey) or presence (blue) of human full-length HPF1 at a 1:1 ratio, recorded at 800 MHz and 25 °C. Protein concentrations were 150 μM, samples contained 50 mM [2H11] Tris pH 7.0, 50 mM NaCl and 2 mM [2H10] DTT in 95:5 H2O/2H2O. The spectra were acquired, processed and contoured identically.

