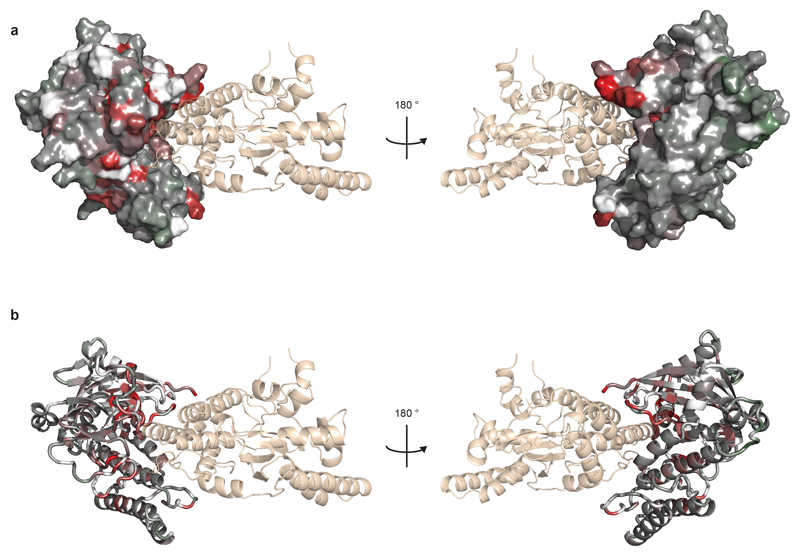
Extended Data Figure 8. Model of the HPF1-PARP1 CAT interaction.
Additional views of the model of the HPF1-PARP1 CAT interaction shown in Fig. 2e. The complex is shown in the same orientations with PARP1 in surface (a) and ribbon (b) representation. Colouring of PARP1 CAT is according to the scale defined in Fig. 2e. HPF1 is coloured beige (“wheat”) and shown in semi-transparent ribbon representation.

