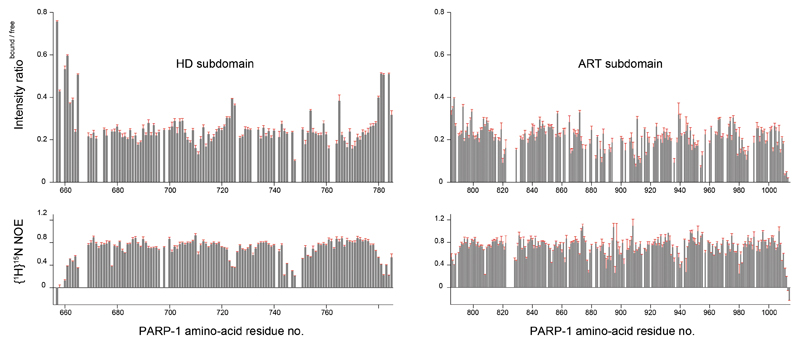
Extended Data Figure 5. Backbone amide signal intensity ratios for PARP1 CAT +/- HPF1.
Expansions of the histograms shown in Fig. 2d, showing backbone amide signal intensity ratios derived from 15N-1H-TROSY spectra of 15N-labelled PARP1656-1014 measured +/- HPF1 (top) and steady-state {1H}15N NOE values for free 15N-labelled PARP1656-1014 (bottom), plotted as a function of PARP1 amino-acid sequence for the HD subdomain (left) and the ART subdomain (i.e. the CAT domain without the HD) (right). Error estimates (in red) were calculated by taking the r. m. s. noise intensity in each spectrum as the measurement error, with the error in intensity ratios propagated according to the standard formula σA/B = (A/B)[(σA/A)2 + (σB/B)2]1/2.

