Fig. 1.
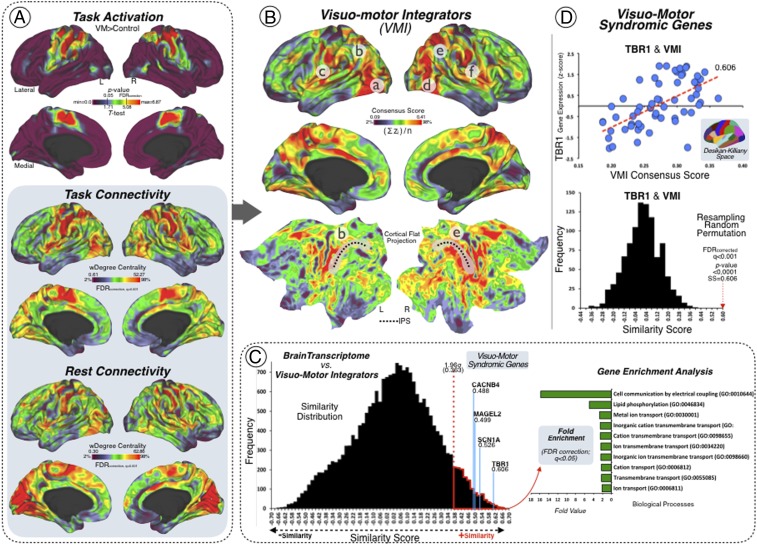
Neuroimaging–genetics results. (A) Three FDR-corrected source brain maps were used for determining the VMI network. (Top) The task-functional MRI activation results related to conducting group-level analysis of a finger-tapping task. (Middle) The task-functional connectivity results associated with the same finger-tapping task. (Bottom) The resting-state functional connectivity results of an independent sample. Each analysis result is displayed in left and right cortical hemispheric surfaces, with lateral and medial projections, and a clear brain color scale (minimum = 2% and maximum = 98% threshold visualization). (B) Visuomotor integrators. Left and right cortical hemispheric surfaces of the VMI network map as a result of combining the three source brain maps (from A): task activation, task connectivity, and rest connectivity. Letters mark the lateral occipital cortex (a and d), the OP4 (c and f), and the IPS (b, e, and black dotted line). Lateral, medial, and flat projections were used in a clear brain color scale (minimum = 2% and maximum = 98% threshold visualization). (C) Syndromic genes linked to the VMI network. (Left) The similarity distribution represents the results of the topographical similarity analysis between the VMI network cortical map and the brain transcriptome map (cortical gene expression map of ∼20,000 protein-coding genes). Genes with high cortical expression within the VMI network have high similarity score (red dotted line above 1.96 SDs). (Right) Fold enrichment (FE) representation of the GO biological profiles of the genes with high cortical expression within the VMI network (FE >2; statistically significant FDR-corrected q < 0.05). (D) TBR1 gene and the VMI network. (Bottom) Scatter plot showing the topographical similarity relationship between the VMI network map and the cortical gene expression of the TBR1 gene across the Desikan–Killiany atlas (linear fit = red dotted line). (Top) Null distribution of the topographical similarity based on a resampling random permutation approach. The red dotted arrow marks the similarity coefficient and the statistically significant P value of the topographical similarity relationship between the VMI network map and the cortical gene expression of the TBR1 gene. L, left; R, right; min, minimum; max, maximum; SS, spatial similarity.

